| Red | Green | Blue | |
| z | 17.64 | ||
| znorm | Inf | ||
| sky | -NaN | -Inf | -Inf |
| S/N | 27.5 | 45.5 | 49.4 |
| S/N(c) | 0.0 | 0.0 | 0.0 |
| SN(E/C) |
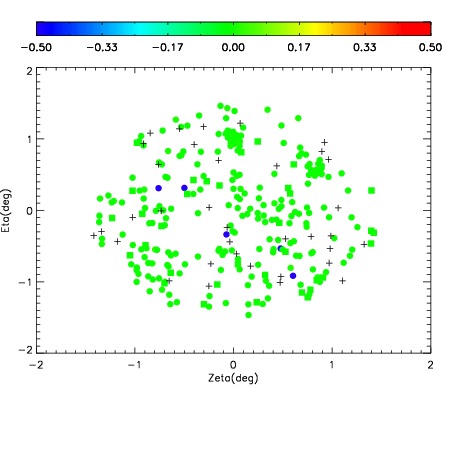
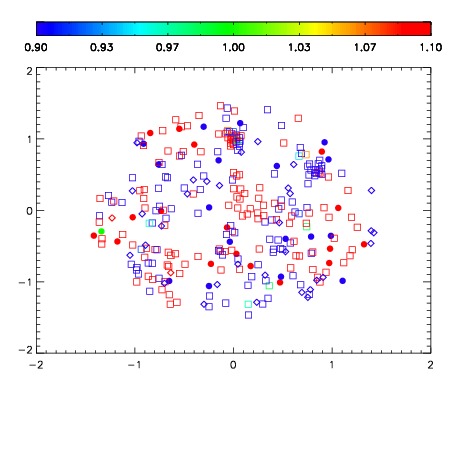
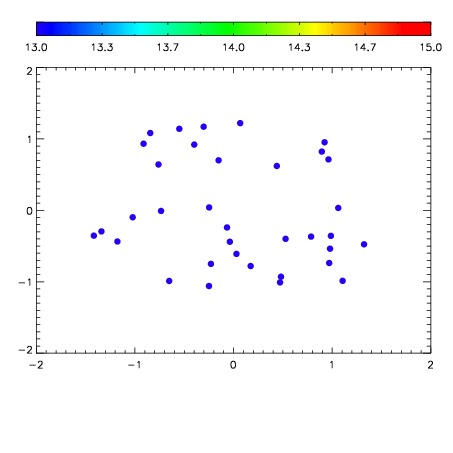

| Frame | Nreads | Zeropoints | Mag plots | Spatial mag deviation | Spatial sky 16325A emission deviations (filled: sky, open: star) | Spatial sky continuum emission | Spatial sky telluric CO2 absorption deviations (filled: H < 10) | |||||||||||||||||||||||
| 0 | 0 |
|
|
|
|
|
|
| IPAIR | NAME | SHIFT | NEWSHIFT | S/N | NAME | SHIFT | NEWSHIFT | S/N |
| 0 | 04290069 | 0.504083 | 0.00000 | 19.0953 | 04290070 | 0.00148772 | 0.502595 | 19.1113 |
| 1 | 04290073 | 0.501180 | 0.00290298 | 19.1198 | 04290071 | 0.000149285 | 0.503934 | 19.1319 |
| 2 | 04290072 | 0.499645 | 0.00443798 | 19.1128 | 04290074 | 0.000735258 | 0.503348 | 19.1272 |
| 3 | 04290068 | 0.500308 | 0.00377500 | 19.0904 | 04290067 | 0.00000 | 0.504083 | 19.0400 |