| Red | Green | Blue | |
| z | 17.63 | ||
| znorm | Inf | ||
| sky | -NaN | -NaN | -NaN |
| S/N | 28.3 | 50.0 | 51.2 |
| S/N(c) | 0.0 | 0.0 | 0.0 |
| SN(E/C) |


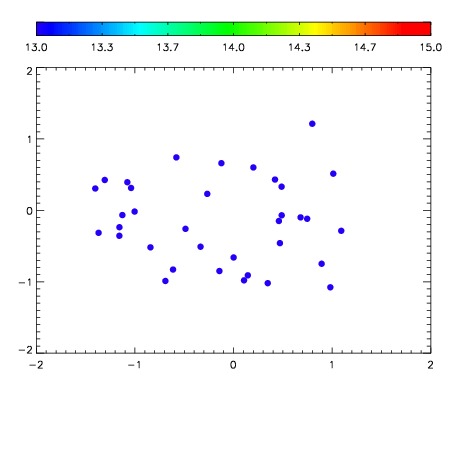

| Frame | Nreads | Zeropoints | Mag plots | Spatial mag deviation | Spatial sky 16325A emission deviations (filled: sky, open: star) | Spatial sky continuum emission | Spatial sky telluric CO2 absorption deviations (filled: H < 10) | |||||||||||||||||||||||
| 0 | 0 |
|
|
|
|
|
|
| IPAIR | NAME | SHIFT | NEWSHIFT | S/N | NAME | SHIFT | NEWSHIFT | S/N |
| 0 | 04300016 | 0.497257 | 0.00000 | 18.9831 | 04300010 | 0.00000 | 0.497257 | 18.8495 |
| 1 | 04300012 | 0.497166 | 9.09865e-05 | 19.1038 | 04300014 | 0.00164480 | 0.495612 | 19.1196 |
| 2 | 04300011 | 0.496031 | 0.00122601 | 19.0317 | 04300013 | 0.00148332 | 0.495774 | 19.0990 |
| 3 | 04300015 | 0.495770 | 0.00148699 | 19.0205 | 04300017 | 0.00413361 | 0.493123 | 19.0975 |