| Red | Green | Blue | |
| z | 17.64 | ||
| znorm | Inf | ||
| sky | -NaN | -NaN | -NaN |
| S/N | 19.4 | 36.9 | 36.8 |
| S/N(c) | 0.0 | 0.0 | 0.0 |
| SN(E/C) |

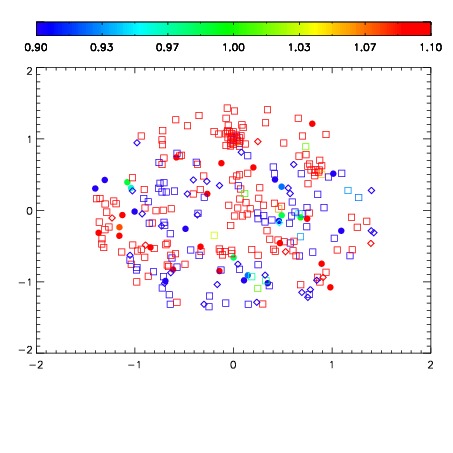
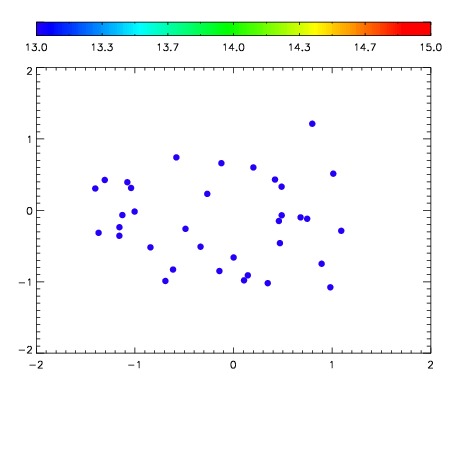

| Frame | Nreads | Zeropoints | Mag plots | Spatial mag deviation | Spatial sky 16325A emission deviations (filled: sky, open: star) | Spatial sky continuum emission | Spatial sky telluric CO2 absorption deviations (filled: H < 10) | |||||||||||||||||||||||
| 0 | 0 |
|
|
|
|
|
|
| IPAIR | NAME | SHIFT | NEWSHIFT | S/N | NAME | SHIFT | NEWSHIFT | S/N |
| 0 | 04570042 | 0.502587 | 0.00000 | 18.6814 | 04570039 | 0.00131292 | 0.501274 | 18.6688 |
| 1 | 04570041 | 0.500260 | 0.00232702 | 18.8843 | 04570040 | 0.00130343 | 0.501284 | 18.8817 |
| 2 | 04570037 | 0.500338 | 0.00224900 | 18.3782 | 04570043 | 0.00565694 | 0.496930 | 18.5541 |
| 3 | 04570038 | 0.501108 | 0.00147903 | 18.1053 | 04570036 | 0.00000 | 0.502587 | 18.3544 |