| Red | Green | Blue | |
| z | 17.64 | ||
| znorm | Inf | ||
| sky | -Inf | -NaN | -Inf |
| S/N | 14.2 | 25.5 | 26.0 |
| S/N(c) | 0.0 | 0.0 | 0.0 |
| SN(E/C) |
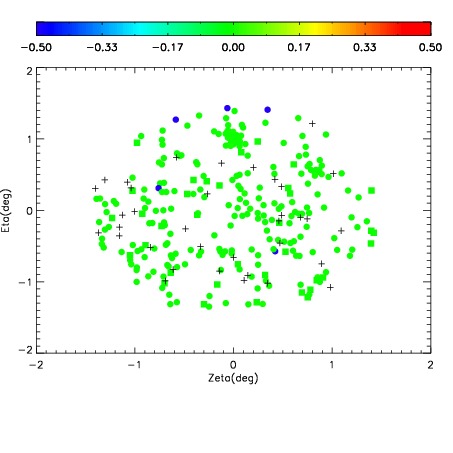
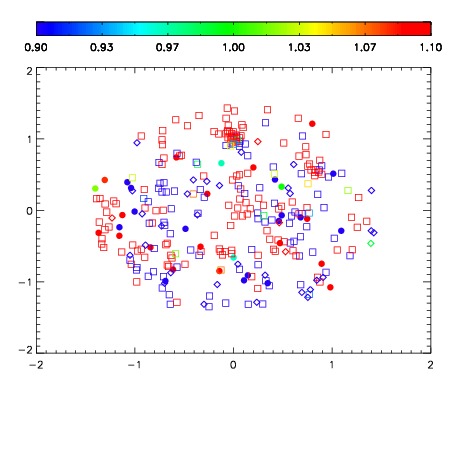
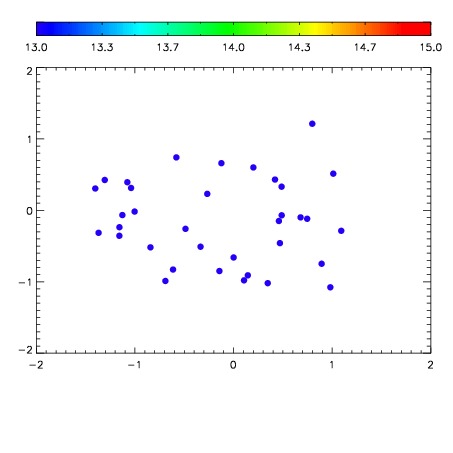

| Frame | Nreads | Zeropoints | Mag plots | Spatial mag deviation | Spatial sky 16325A emission deviations (filled: sky, open: star) | Spatial sky continuum emission | Spatial sky telluric CO2 absorption deviations (filled: H < 10) | |||||||||||||||||||||||
| 0 | 0 |
|
|
|
|
|
|
| IPAIR | NAME | SHIFT | NEWSHIFT | S/N | NAME | SHIFT | NEWSHIFT | S/N |
| 0 | 04590021 | 0.505596 | 0.00000 | 17.6694 | 04590022 | 0.00190303 | 0.503693 | 17.5079 |
| 1 | 04590020 | 0.501897 | 0.00369900 | 18.9141 | 04590019 | 0.00000 | 0.505596 | 18.9043 |
| 2 | 04590024 | 0.503494 | 0.00210196 | 17.7490 | 04590023 | 0.000888086 | 0.504708 | 17.9019 |
| 3 | 04590025 | 0.504669 | 0.000926971 | 16.8686 | 04590026 | 0.00426026 | 0.501336 | 16.4685 |