| Red | Green | Blue | |
| z | 17.64 | ||
| znorm | Inf | ||
| sky | -NaN | -NaN | -Inf |
| S/N | 23.4 | 38.6 | 43.4 |
| S/N(c) | 0.0 | 0.0 | 0.0 |
| SN(E/C) |
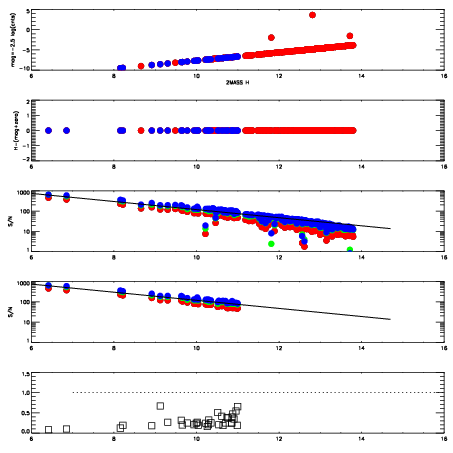

| Frame | Nreads | Zeropoints | Mag plots | Spatial mag deviation | Spatial sky 16325A emission deviations (filled: sky, open: star) | Spatial sky continuum emission | Spatial sky telluric CO2 absorption deviations (filled: H < 10) | |||||||||||||||||||||||
| 0 | 0 |
|
|
|
|
|
|
| IPAIR | NAME | SHIFT | NEWSHIFT | S/N | NAME | SHIFT | NEWSHIFT | S/N |
| 0 | 04600053 | 0.495496 | 0.00000 | 18.9087 | 04600050 | 0.00122391 | 0.494272 | 18.9841 |
| 1 | 04600048 | 0.493972 | 0.00152400 | 18.8555 | 04600047 | 0.00000 | 0.495496 | 18.9672 |
| 2 | 04600049 | 0.495049 | 0.000447005 | 18.8457 | 04600051 | -0.000199100 | 0.495695 | 18.9645 |
| 3 | 04600052 | 0.494478 | 0.00101802 | 18.6544 | 04600054 | 0.00176856 | 0.493727 | 18.8390 |