| Red | Green | Blue | |
| z | 17.64 | ||
| znorm | Inf | ||
| sky | -Inf | -NaN | -NaN |
| S/N | 32.9 | 57.0 | 63.4 |
| S/N(c) | 0.0 | 0.0 | 0.0 |
| SN(E/C) |
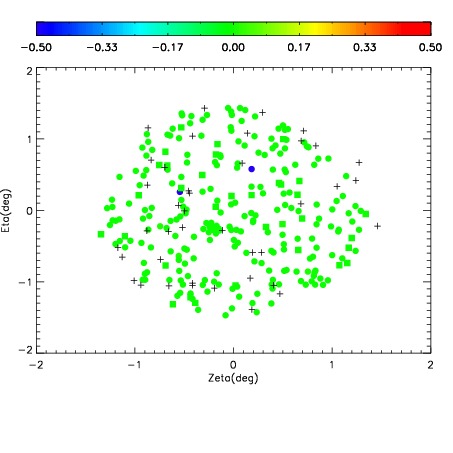
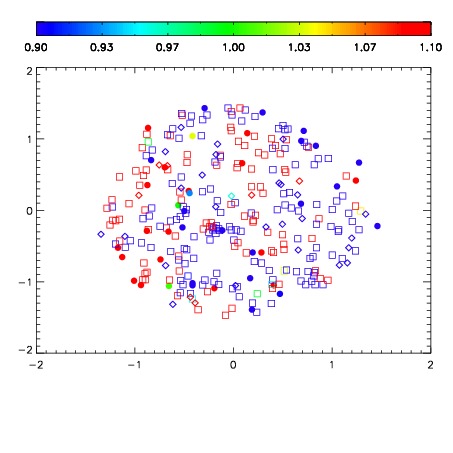
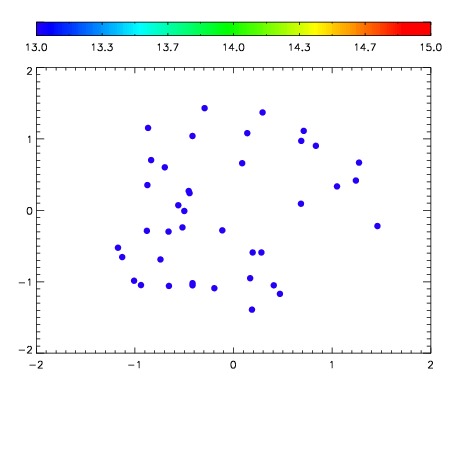

| Frame | Nreads | Zeropoints | Mag plots | Spatial mag deviation | Spatial sky 16325A emission deviations (filled: sky, open: star) | Spatial sky continuum emission | Spatial sky telluric CO2 absorption deviations (filled: H < 10) | |||||||||||||||||||||||
| 0 | 0 |
|
|
|
|
|
|
| IPAIR | NAME | SHIFT | NEWSHIFT | S/N | NAME | SHIFT | NEWSHIFT | S/N |
| 0 | 03720098 | 0.510485 | 0.00000 | 19.0115 | 03720108 | 0.000333825 | 0.510151 | 19.0834 |
| 1 | 03720107 | 0.499786 | 0.0106990 | 19.0594 | 03720105 | -0.000514716 | 0.511000 | 19.1184 |
| 2 | 03720106 | 0.498671 | 0.0118140 | 19.0526 | 03720100 | 0.000542331 | 0.509943 | 19.0876 |
| 3 | 03720099 | 0.510377 | 0.000108004 | 19.0442 | 03720101 | 0.00151408 | 0.508971 | 19.0870 |
| 4 | 03720102 | 0.500217 | 0.0102680 | 19.0088 | 03720104 | -0.000451651 | 0.510937 | 19.0803 |
| 5 | 03720103 | 0.501112 | 0.00937301 | 18.9472 | 03720097 | 0.00000 | 0.510485 | 18.9542 |