| Red | Green | Blue | |
| z | 17.64 | ||
| znorm | Inf | ||
| sky | -Inf | -Inf | -Inf |
| S/N | 27.2 | 46.7 | 50.7 |
| S/N(c) | 0.0 | 0.0 | 0.0 |
| SN(E/C) |
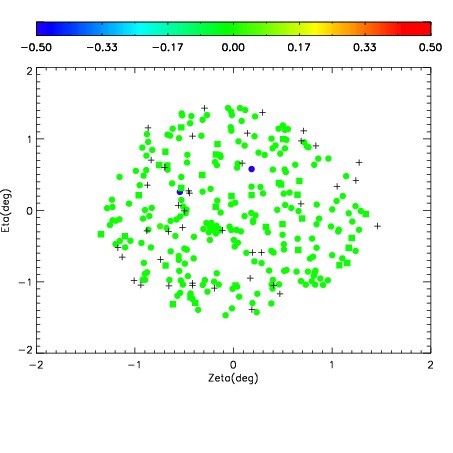
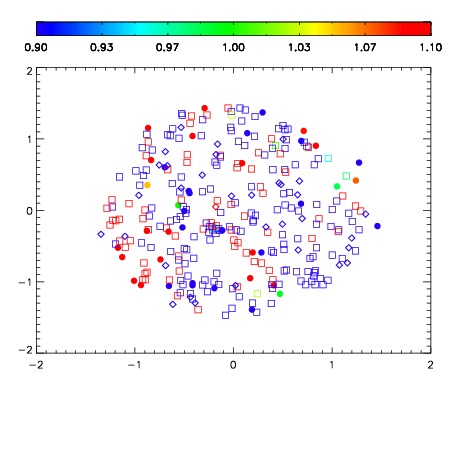
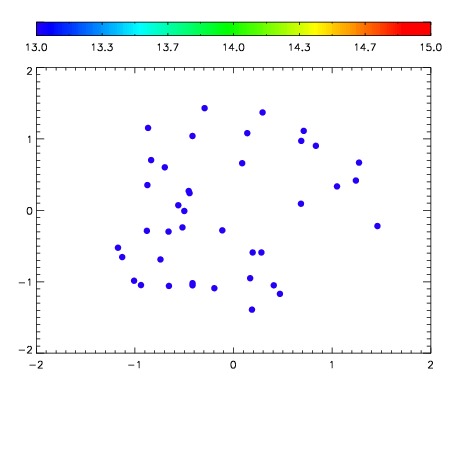

| Frame | Nreads | Zeropoints | Mag plots | Spatial mag deviation | Spatial sky 16325A emission deviations (filled: sky, open: star) | Spatial sky continuum emission | Spatial sky telluric CO2 absorption deviations (filled: H < 10) | |||||||||||||||||||||||
| 0 | 0 |
|
|
|
|
|
|
| IPAIR | NAME | SHIFT | NEWSHIFT | S/N | NAME | SHIFT | NEWSHIFT | S/N |
| 0 | 04060061 | 0.497840 | 0.00000 | 19.1787 | 04060062 | -0.00137843 | 0.499218 | 19.1062 |
| 1 | 04060060 | 0.494151 | 0.00368899 | 19.1734 | 04060059 | 0.00000 | 0.497840 | 19.0986 |
| 2 | 04060065 | 0.494666 | 0.00317398 | 19.0757 | 04060066 | 0.000708642 | 0.497131 | 18.9039 |
| 3 | 04060064 | 0.494146 | 0.00369400 | 19.0080 | 04060063 | -0.00106229 | 0.498902 | 18.7958 |