| Red | Green | Blue | |
| z | 17.64 | ||
| znorm | Inf | ||
| sky | -Inf | -Inf | -NaN |
| S/N | 28.8 | 48.3 | 51.8 |
| S/N(c) | 0.0 | 0.0 | 0.0 |
| SN(E/C) |
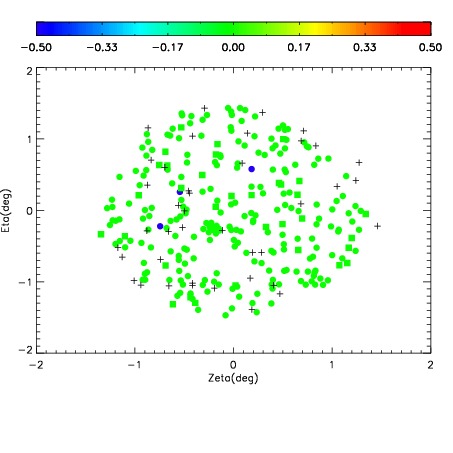
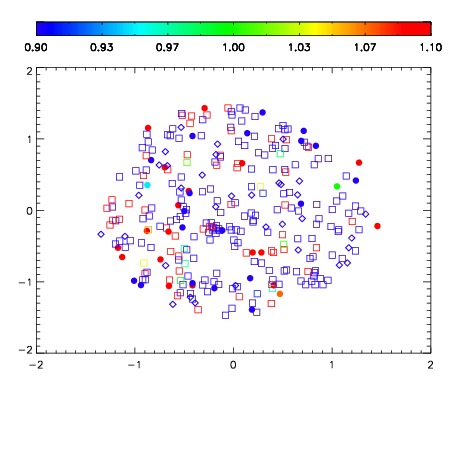


| Frame | Nreads | Zeropoints | Mag plots | Spatial mag deviation | Spatial sky 16325A emission deviations (filled: sky, open: star) | Spatial sky continuum emission | Spatial sky telluric CO2 absorption deviations (filled: H < 10) | |||||||||||||||||||||||
| 0 | 0 |
|
|
|
|
|
|
| IPAIR | NAME | SHIFT | NEWSHIFT | S/N | NAME | SHIFT | NEWSHIFT | S/N |
| 0 | 04620018 | 0.495530 | 0.00000 | 19.1448 | 04620020 | -0.000617922 | 0.496148 | 19.1291 |
| 1 | 04620017 | 0.494594 | 0.000936002 | 19.1665 | 04620023 | -0.000908464 | 0.496438 | 19.1342 |
| 2 | 04620022 | 0.493444 | 0.00208601 | 19.1415 | 04620019 | 0.000490344 | 0.495040 | 19.1257 |
| 3 | 04620021 | 0.493068 | 0.00246200 | 19.1316 | 04620016 | 0.00000 | 0.495530 | 19.1151 |