| Red | Green | Blue | |
| z | 17.64 | ||
| znorm | Inf | ||
| sky | -Inf | -Inf | -Inf |
| S/N | 22.8 | 41.3 | 45.4 |
| S/N(c) | 0.0 | 0.0 | 0.0 |
| SN(E/C) |
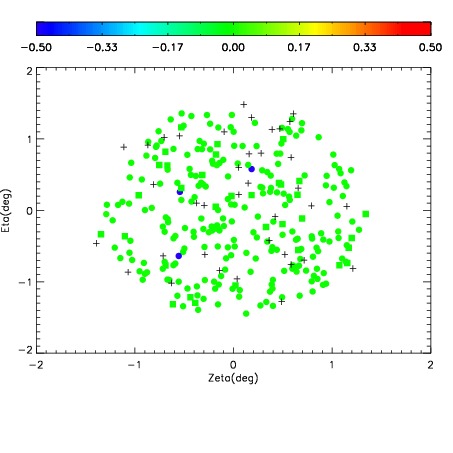
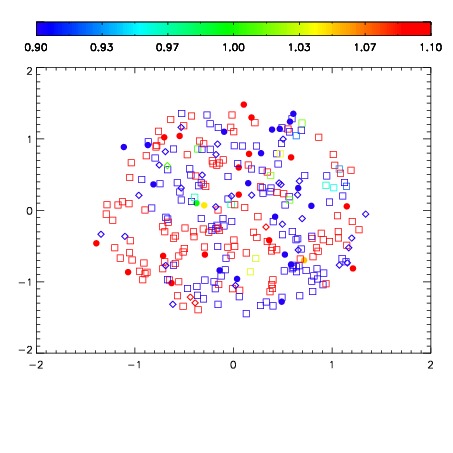


| Frame | Nreads | Zeropoints | Mag plots | Spatial mag deviation | Spatial sky 16325A emission deviations (filled: sky, open: star) | Spatial sky continuum emission | Spatial sky telluric CO2 absorption deviations (filled: H < 10) | |||||||||||||||||||||||
| 0 | 0 |
|
|
|
|
|
|
| IPAIR | NAME | SHIFT | NEWSHIFT | S/N | NAME | SHIFT | NEWSHIFT | S/N |
| 0 | 03760105 | 0.510654 | 0.00000 | 18.6120 | 03760106 | 0.00183036 | 0.508824 | 18.5371 |
| 1 | 03760100 | 0.509655 | 0.000998974 | 19.0682 | 03760099 | 0.00000 | 0.510654 | 19.0350 |
| 2 | 03760101 | 0.510531 | 0.000122964 | 19.0082 | 03760103 | -0.000910137 | 0.511564 | 18.9708 |
| 3 | 03760104 | 0.509618 | 0.00103599 | 18.6893 | 03760102 | 0.000350478 | 0.510303 | 18.8093 |