| Red | Green | Blue | |
| z | 17.64 | ||
| znorm | Inf | ||
| sky | -Inf | -NaN | -Inf |
| S/N | 27.5 | 48.4 | 53.2 |
| S/N(c) | 0.0 | 0.0 | 0.0 |
| SN(E/C) |
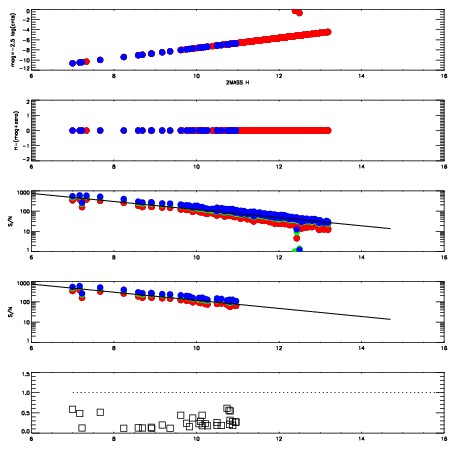
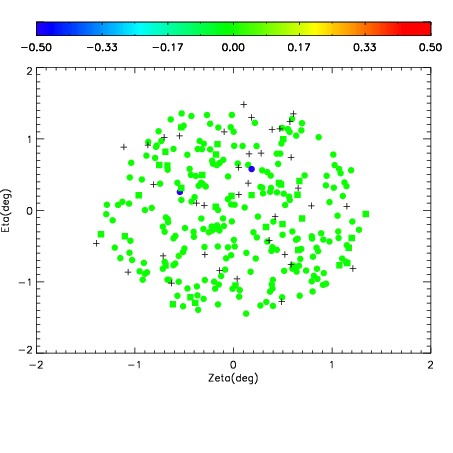
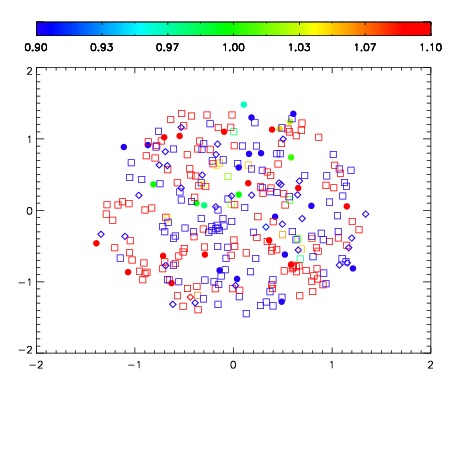
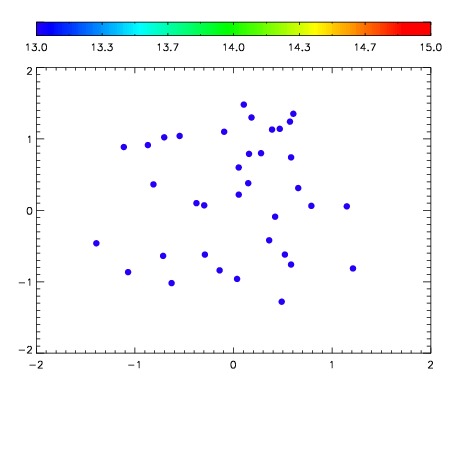

| Frame | Nreads | Zeropoints | Mag plots | Spatial mag deviation | Spatial sky 16325A emission deviations (filled: sky, open: star) | Spatial sky continuum emission | Spatial sky telluric CO2 absorption deviations (filled: H < 10) | |||||||||||||||||||||||
| 0 | 0 |
|
|
|
|
|
|
| IPAIR | NAME | SHIFT | NEWSHIFT | S/N | NAME | SHIFT | NEWSHIFT | S/N |
| 0 | 04860055 | 0.491410 | 0.00000 | 19.1001 | 04860056 | -0.00611225 | 0.497522 | 19.0494 |
| 1 | 04860050 | 0.489070 | 0.00233999 | 19.1214 | 04860052 | 0.00152524 | 0.489885 | 19.1454 |
| 2 | 04860054 | 0.490965 | 0.000444978 | 19.1035 | 04860053 | -0.000461329 | 0.491871 | 19.1194 |
| 3 | 04860051 | 0.491367 | 4.29749e-05 | 19.1007 | 04860049 | 0.00000 | 0.491410 | 19.0946 |