| Red | Green | Blue | |
| z | 17.64 | ||
| znorm | Inf | ||
| sky | -Inf | -NaN | -NaN |
| S/N | 21.4 | 38.2 | 40.1 |
| S/N(c) | 0.0 | 0.0 | 0.0 |
| SN(E/C) |
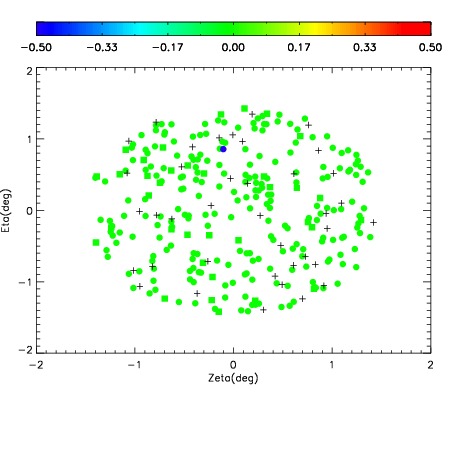

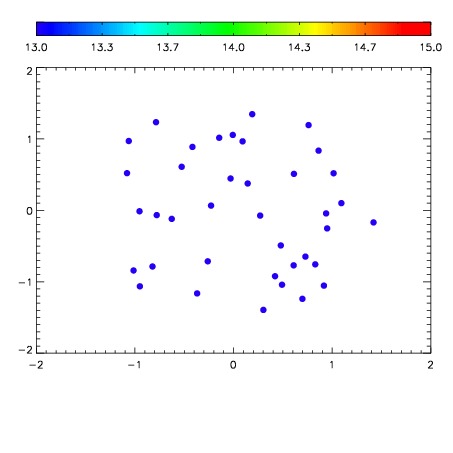

| Frame | Nreads | Zeropoints | Mag plots | Spatial mag deviation | Spatial sky 16325A emission deviations (filled: sky, open: star) | Spatial sky continuum emission | Spatial sky telluric CO2 absorption deviations (filled: H < 10) | |||||||||||||||||||||||
| 0 | 0 |
|
|
|
|
|
|
| IPAIR | NAME | SHIFT | NEWSHIFT | S/N | NAME | SHIFT | NEWSHIFT | S/N |
| 0 | 10830035 | 0.492695 | 0.00000 | 18.5689 | 10830036 | -0.00203025 | 0.494725 | 18.7038 |
| 1 | 10830039 | 0.491908 | 0.000786990 | 18.8419 | 10830040 | -0.00237588 | 0.495071 | 18.9513 |
| 2 | 10830038 | 0.490983 | 0.00171199 | 18.7764 | 10830033 | 0.00000 | 0.492695 | 18.7333 |
| 3 | 10830034 | 0.492355 | 0.000340015 | 18.5352 | 10830037 | -0.00198751 | 0.494683 | 18.5643 |