| Red | Green | Blue | |
| z | 17.64 | ||
| znorm | Inf | ||
| sky | -NaN | -NaN | -Inf |
| S/N | 22.2 | 40.5 | 42.5 |
| S/N(c) | 0.0 | 0.0 | 0.0 |
| SN(E/C) |
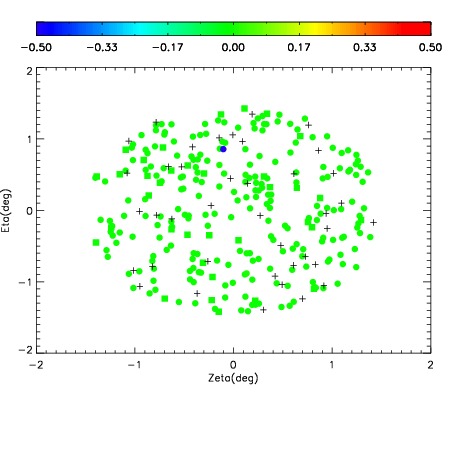
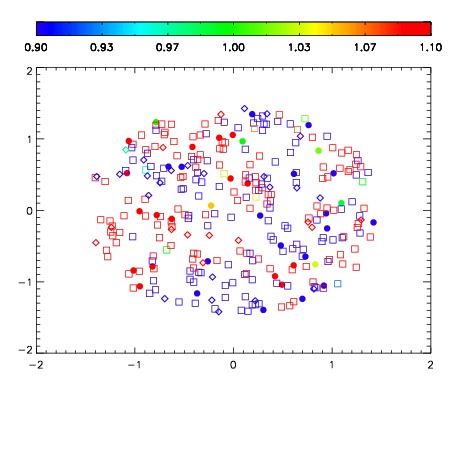
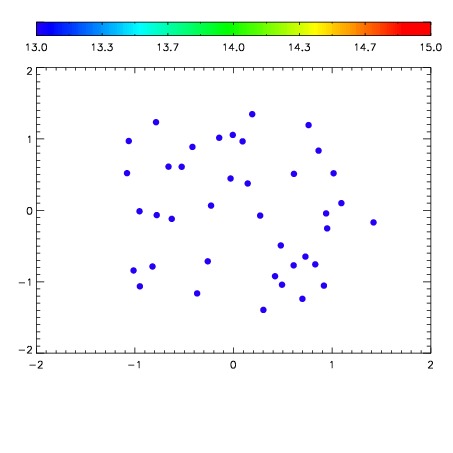

| Frame | Nreads | Zeropoints | Mag plots | Spatial mag deviation | Spatial sky 16325A emission deviations (filled: sky, open: star) | Spatial sky continuum emission | Spatial sky telluric CO2 absorption deviations (filled: H < 10) | |||||||||||||||||||||||
| 0 | 0 |
|
|
|
|
|
|
| IPAIR | NAME | SHIFT | NEWSHIFT | S/N | NAME | SHIFT | NEWSHIFT | S/N |
| 0 | 11070083 | 0.481958 | 0.00000 | 18.1977 | 11070082 | 0.000938351 | 0.481020 | 18.3345 |
| 1 | 11070075 | 0.479633 | 0.00232500 | 18.9318 | 11070074 | 0.00000 | 0.481958 | 18.9126 |
| 2 | 11070076 | 0.480117 | 0.00184101 | 18.8579 | 11070077 | 0.00165441 | 0.480304 | 18.7569 |
| 3 | 11070080 | 0.481589 | 0.000369012 | 18.7270 | 11070078 | 0.00303778 | 0.478920 | 18.6352 |
| 4 | 11070079 | 0.481518 | 0.000440001 | 18.5239 | 11070081 | 0.00104899 | 0.480909 | 18.6274 |