| Red | Green | Blue | |
| z | 17.64 | ||
| znorm | Inf | ||
| sky | -Inf | -NaN | -Inf |
| S/N | 23.7 | 41.5 | 44.4 |
| S/N(c) | 0.0 | 0.0 | 0.0 |
| SN(E/C) |
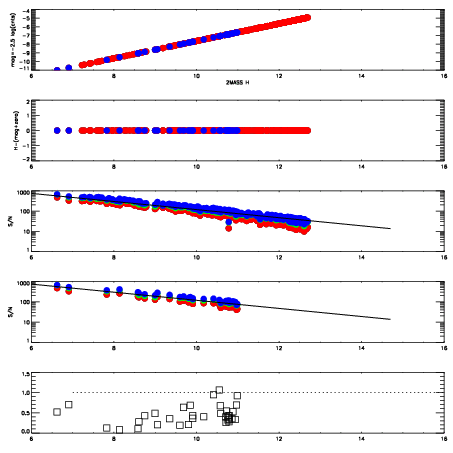

| Frame | Nreads | Zeropoints | Mag plots | Spatial mag deviation | Spatial sky 16325A emission deviations (filled: sky, open: star) | Spatial sky continuum emission | Spatial sky telluric CO2 absorption deviations (filled: H < 10) | |||||||||||||||||||||||
| 0 | 0 |
|
|
|
|
|
|
| IPAIR | NAME | SHIFT | NEWSHIFT | S/N | NAME | SHIFT | NEWSHIFT | S/N |
| 0 | 03710093 | 0.508649 | 0.00000 | 18.8444 | 03710091 | 0.000133759 | 0.508515 | 18.9386 |
| 1 | 03710092 | 0.506705 | 0.00194401 | 18.9783 | 03710090 | 0.000905124 | 0.507744 | 19.0012 |
| 2 | 03710089 | 0.505587 | 0.00306201 | 18.9353 | 03710094 | 0.00291068 | 0.505738 | 19.0008 |
| 3 | 03710088 | 0.504279 | 0.00436997 | 18.8645 | 03710087 | 0.00000 | 0.508649 | 18.9861 |