| Red | Green | Blue | |
| z | 17.64 | ||
| znorm | Inf | ||
| sky | -NaN | -Inf | -Inf |
| S/N | 16.9 | 30.4 | 34.0 |
| S/N(c) | 0.0 | 0.0 | 0.0 |
| SN(E/C) |
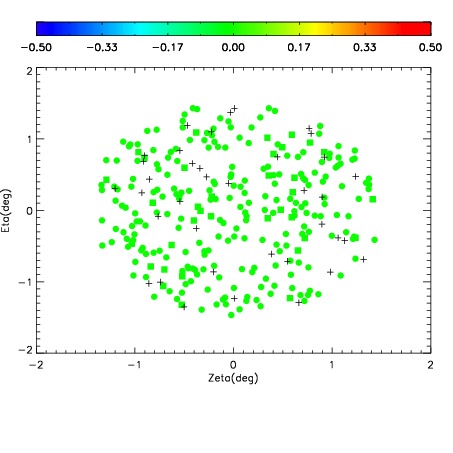
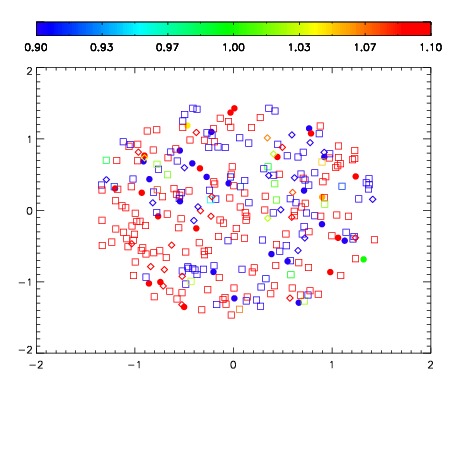
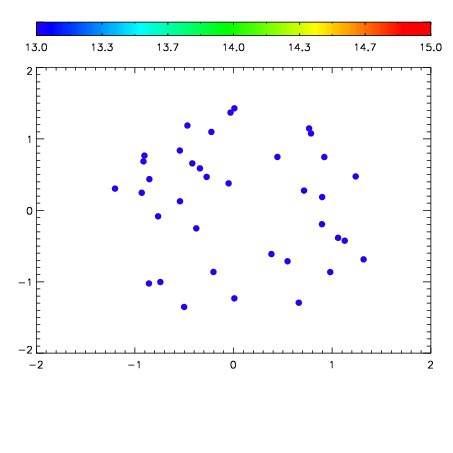

| Frame | Nreads | Zeropoints | Mag plots | Spatial mag deviation | Spatial sky 16325A emission deviations (filled: sky, open: star) | Spatial sky continuum emission | Spatial sky telluric CO2 absorption deviations (filled: H < 10) | |||||||||||||||||||||||
| 0 | 0 |
|
|
|
|
|
|
| IPAIR | NAME | SHIFT | NEWSHIFT | S/N | NAME | SHIFT | NEWSHIFT | S/N |
| 0 | 11390072 | 0.476445 | 0.00000 | 18.4750 | 11390069 | -0.000154081 | 0.476599 | 18.5912 |
| 1 | 11390068 | 0.475037 | 0.00140798 | 18.4272 | 11390073 | 0.00128721 | 0.475158 | 18.5865 |
| 2 | 11390067 | 0.474797 | 0.00164798 | 18.3589 | 11390070 | -0.000472799 | 0.476918 | 18.3775 |
| 3 | 11390071 | 0.475732 | 0.000712991 | 18.3064 | 11390066 | 0.00000 | 0.476445 | 17.7648 |