| Red | Green | Blue | |
| z | 17.64 | ||
| znorm | Inf | ||
| sky | -Inf | -NaN | -Inf |
| S/N | 17.5 | 30.8 | 33.0 |
| S/N(c) | 0.0 | 0.0 | 0.0 |
| SN(E/C) |
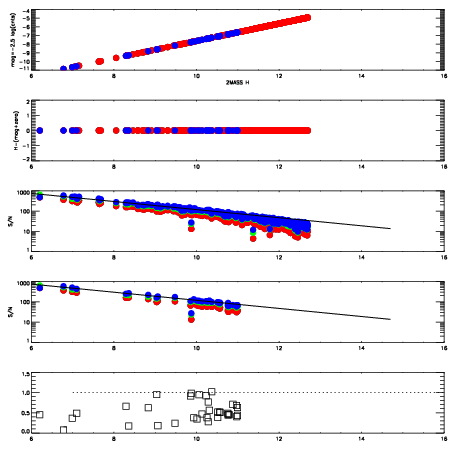
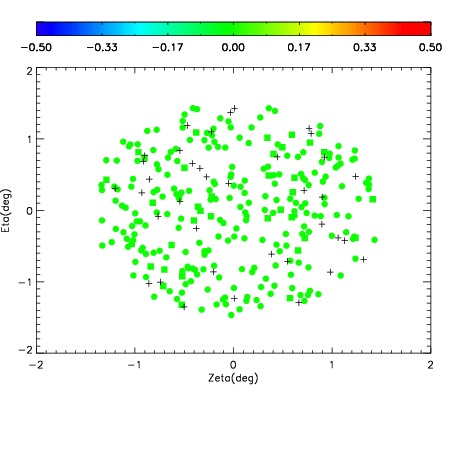
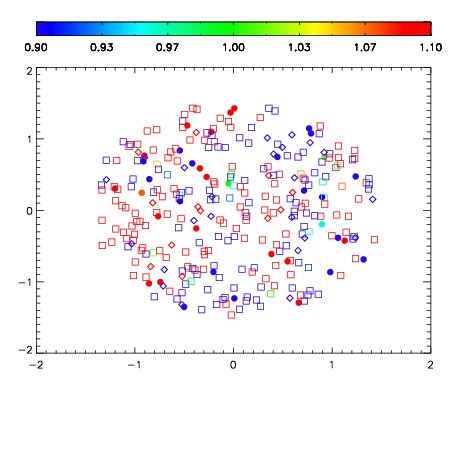


| Frame | Nreads | Zeropoints | Mag plots | Spatial mag deviation | Spatial sky 16325A emission deviations (filled: sky, open: star) | Spatial sky continuum emission | Spatial sky telluric CO2 absorption deviations (filled: H < 10) | |||||||||||||||||||||||
| 0 | 0 |
|
|
|
|
|
|
| IPAIR | NAME | SHIFT | NEWSHIFT | S/N | NAME | SHIFT | NEWSHIFT | S/N |
| 0 | 11450046 | 0.472963 | 0.00000 | 18.7915 | 11450044 | 0.00000 | 0.472963 | 18.8812 |
| 1 | 11450045 | 0.472626 | 0.000337005 | 18.7567 | 11450051 | -0.00785839 | 0.480821 | 18.7364 |
| 2 | 11450050 | 0.472546 | 0.000416994 | 18.2014 | 11450047 | -0.00709848 | 0.480061 | 18.3667 |
| 3 | 11450049 | 0.472159 | 0.000804007 | 18.0342 | 11450048 | -0.00688778 | 0.479851 | 17.6643 |