| Red | Green | Blue | |
| z | 17.64 | ||
| znorm | Inf | ||
| sky | -Inf | -NaN | -Inf |
| S/N | 13.2 | 23.3 | 24.7 |
| S/N(c) | 0.0 | 0.0 | 0.0 |
| SN(E/C) |
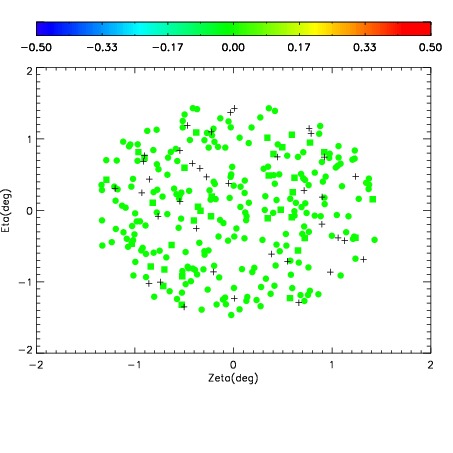
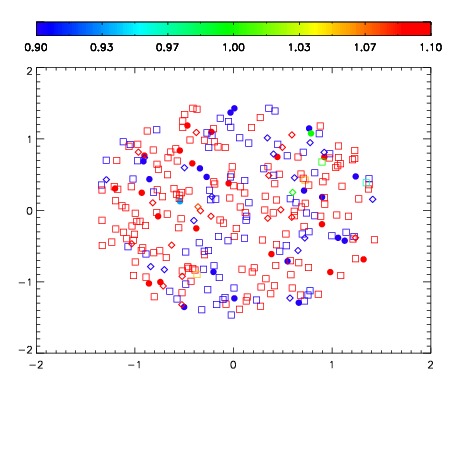
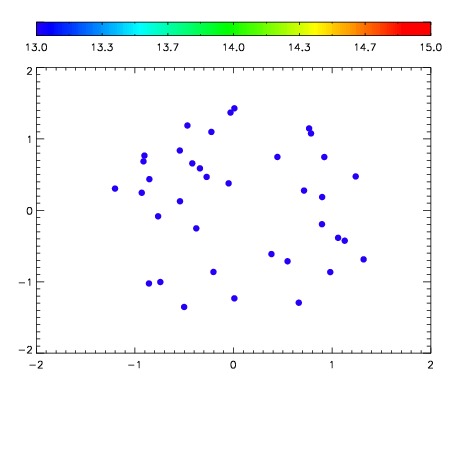

| Frame | Nreads | Zeropoints | Mag plots | Spatial mag deviation | Spatial sky 16325A emission deviations (filled: sky, open: star) | Spatial sky continuum emission | Spatial sky telluric CO2 absorption deviations (filled: H < 10) | |||||||||||||||||||||||
| 0 | 0 |
|
|
|
|
|
|
| IPAIR | NAME | SHIFT | NEWSHIFT | S/N | NAME | SHIFT | NEWSHIFT | S/N |
| 0 | 11720046 | 0.491895 | 0.00000 | 17.9641 | 11720047 | -0.00258270 | 0.494478 | 17.6449 |
| 1 | 11720050 | 0.490790 | 0.00110498 | 18.2415 | 11720051 | -0.00357645 | 0.495471 | 18.2265 |
| 2 | 11720049 | 0.491122 | 0.000772983 | 18.2154 | 11720048 | -0.00308097 | 0.494976 | 18.0378 |
| 3 | 11720045 | 0.491517 | 0.000377983 | 18.0762 | 11720044 | 0.00000 | 0.491895 | 17.9974 |