| Red | Green | Blue | |
| z | 17.64 | ||
| znorm | Inf | ||
| sky | -Inf | -Inf | -Inf |
| S/N | 25.4 | 45.1 | 48.5 |
| S/N(c) | 0.0 | 0.0 | 0.0 |
| SN(E/C) |
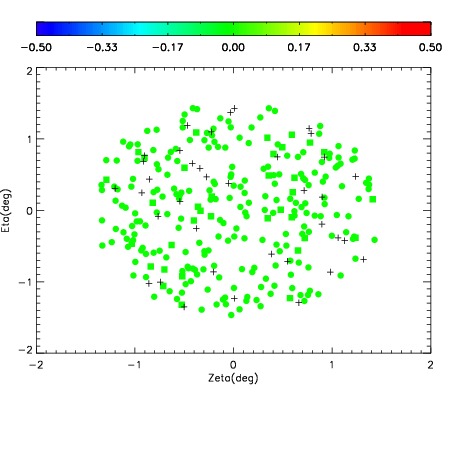
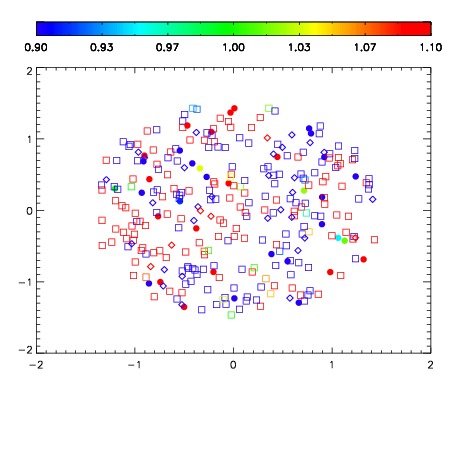
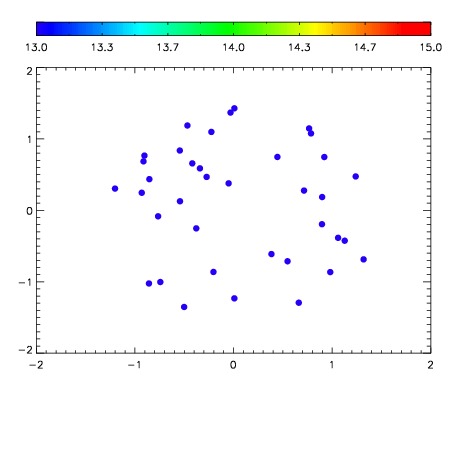

| Frame | Nreads | Zeropoints | Mag plots | Spatial mag deviation | Spatial sky 16325A emission deviations (filled: sky, open: star) | Spatial sky continuum emission | Spatial sky telluric CO2 absorption deviations (filled: H < 10) | |||||||||||||||||||||||
| 0 | 0 |
|
|
|
|
|
|
| IPAIR | NAME | SHIFT | NEWSHIFT | S/N | NAME | SHIFT | NEWSHIFT | S/N |
| 0 | 11950042 | 0.503029 | 0.00000 | 19.0393 | 11950040 | -0.00275123 | 0.505780 | 18.9994 |
| 1 | 11950041 | 0.502829 | 0.000199974 | 19.0696 | 11950043 | -0.00203557 | 0.505065 | 19.0790 |
| 2 | 11950038 | 0.500585 | 0.00244397 | 18.9389 | 11950039 | -0.00325536 | 0.506284 | 18.9588 |
| 3 | 11950037 | 0.501403 | 0.00162601 | 18.8812 | 11950036 | 0.00000 | 0.503029 | 18.8575 |