| Red | Green | Blue | |
| z | 17.64 | ||
| znorm | Inf | ||
| sky | -Inf | -Inf | -Inf |
| S/N | 19.8 | 36.0 | 37.4 |
| S/N(c) | 0.0 | 0.0 | 0.0 |
| SN(E/C) |
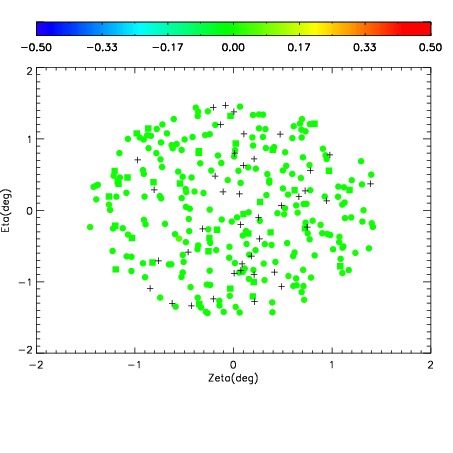
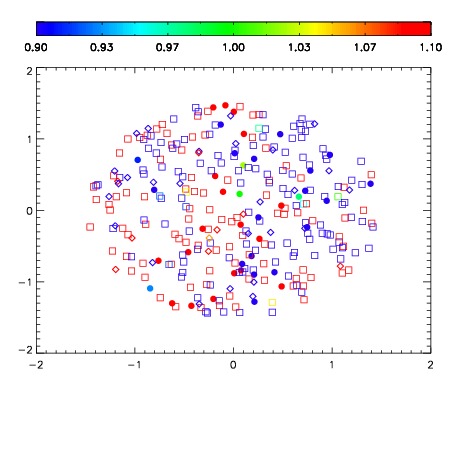
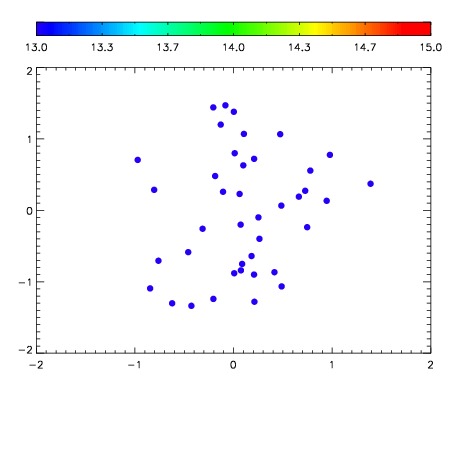

| Frame | Nreads | Zeropoints | Mag plots | Spatial mag deviation | Spatial sky 16325A emission deviations (filled: sky, open: star) | Spatial sky continuum emission | Spatial sky telluric CO2 absorption deviations (filled: H < 10) | |||||||||||||||||||||||
| 0 | 0 |
|
|
|
|
|
|
| IPAIR | NAME | SHIFT | NEWSHIFT | S/N | NAME | SHIFT | NEWSHIFT | S/N |
| 0 | 08730024 | 0.481123 | 0.00000 | 18.8471 | 08730026 | -2.97416e-05 | 0.481153 | 18.9332 |
| 1 | 08730023 | 0.480967 | 0.000156015 | 18.8725 | 08730022 | 0.00000 | 0.481123 | 18.9420 |
| 2 | 08730028 | 0.480056 | 0.00106701 | 18.6843 | 08730025 | 0.000793671 | 0.480329 | 18.8661 |
| 3 | 08730027 | 0.479926 | 0.00119701 | 18.5499 | 08730029 | 0.00415500 | 0.476968 | 18.5097 |