| Red | Green | Blue | |
| z | 17.64 | ||
| znorm | Inf | ||
| sky | -NaN | -NaN | -Inf |
| S/N | 21.6 | 38.4 | 41.5 |
| S/N(c) | 0.0 | 0.0 | 0.0 |
| SN(E/C) |
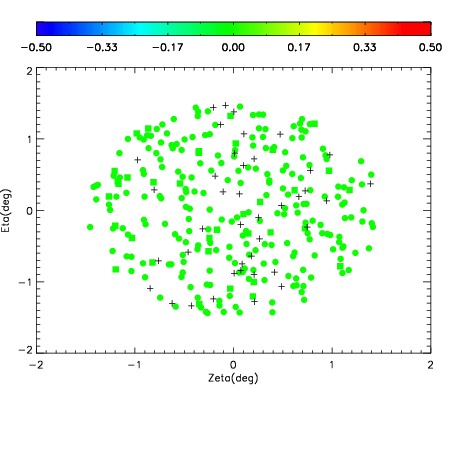
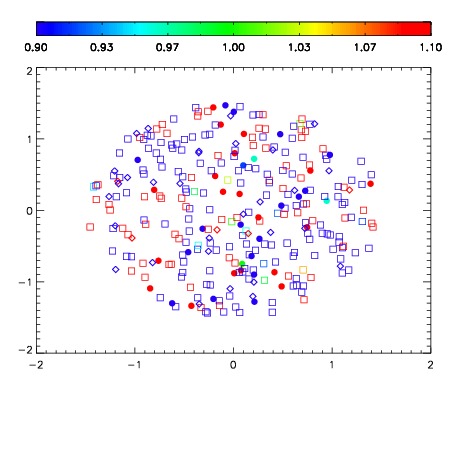


| Frame | Nreads | Zeropoints | Mag plots | Spatial mag deviation | Spatial sky 16325A emission deviations (filled: sky, open: star) | Spatial sky continuum emission | Spatial sky telluric CO2 absorption deviations (filled: H < 10) | |||||||||||||||||||||||
| 0 | 0 |
|
|
|
|
|
|
| IPAIR | NAME | SHIFT | NEWSHIFT | S/N | NAME | SHIFT | NEWSHIFT | S/N |
| 0 | 08770016 | 0.482640 | 0.00000 | 18.9804 | 08770017 | 0.00308025 | 0.479560 | 18.9337 |
| 1 | 08770015 | 0.482269 | 0.000371009 | 18.9322 | 08770014 | 0.00396256 | 0.478677 | 18.9056 |
| 2 | 08770012 | 0.480579 | 0.00206101 | 18.8003 | 08770010 | 0.00000 | 0.482640 | 18.8136 |
| 3 | 08770011 | 0.480683 | 0.00195700 | 18.5596 | 08770013 | 0.00375690 | 0.478883 | 18.4776 |