| Red | Green | Blue | |
| z | 17.64 | ||
| znorm | Inf | ||
| sky | -Inf | -Inf | -Inf |
| S/N | 18.8 | 35.2 | 37.1 |
| S/N(c) | 0.0 | 0.0 | 0.0 |
| SN(E/C) |
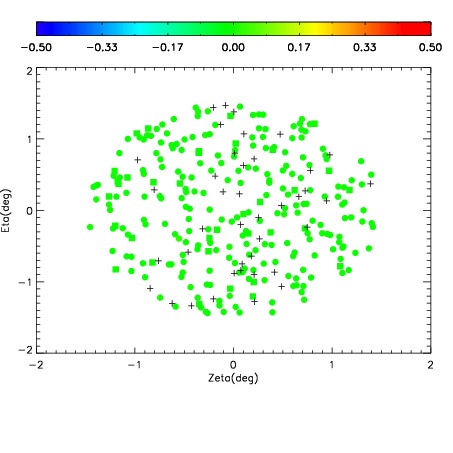
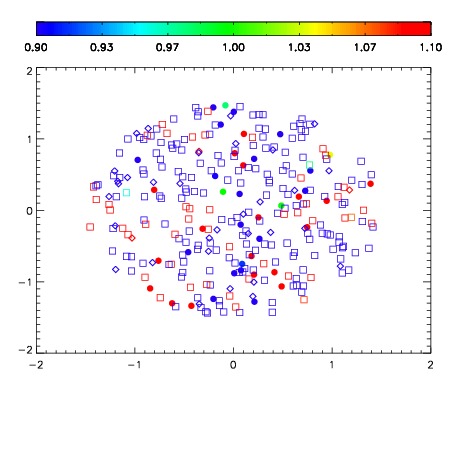
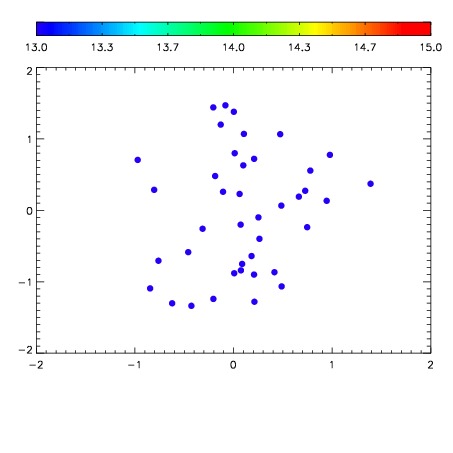

| Frame | Nreads | Zeropoints | Mag plots | Spatial mag deviation | Spatial sky 16325A emission deviations (filled: sky, open: star) | Spatial sky continuum emission | Spatial sky telluric CO2 absorption deviations (filled: H < 10) | |||||||||||||||||||||||
| 0 | 0 |
|
|
|
|
|
|
| IPAIR | NAME | SHIFT | NEWSHIFT | S/N | NAME | SHIFT | NEWSHIFT | S/N |
| 0 | 11190013 | 0.475916 | 0.00000 | 18.8529 | 11190014 | -0.00443703 | 0.480353 | 18.8813 |
| 1 | 11190016 | 0.473906 | 0.00200999 | 18.8680 | 11190015 | -0.00486881 | 0.480785 | 18.9066 |
| 2 | 11190012 | 0.475714 | 0.000202000 | 18.8495 | 11190011 | 0.00000 | 0.475916 | 18.8069 |