| Red | Green | Blue | |
| z | 17.64 | ||
| znorm | Inf | ||
| sky | -Inf | -Inf | -Inf |
| S/N | 23.5 | 41.3 | 44.3 |
| S/N(c) | 0.0 | 0.0 | 0.0 |
| SN(E/C) |
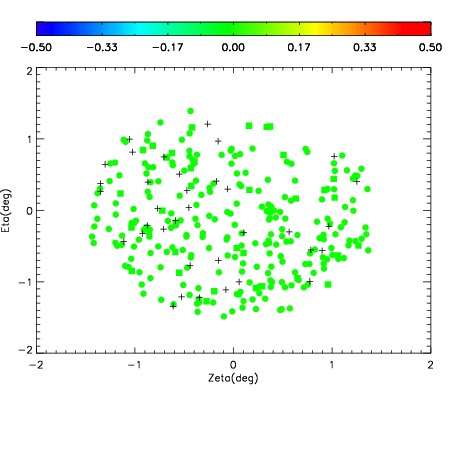
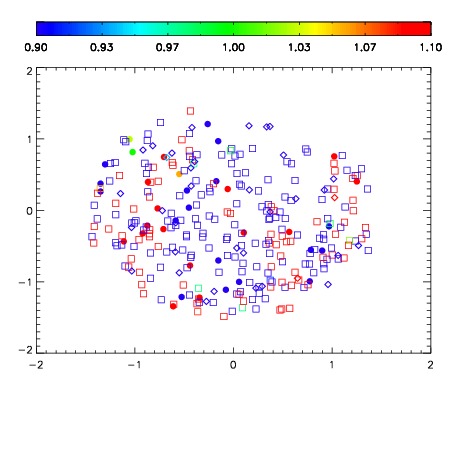
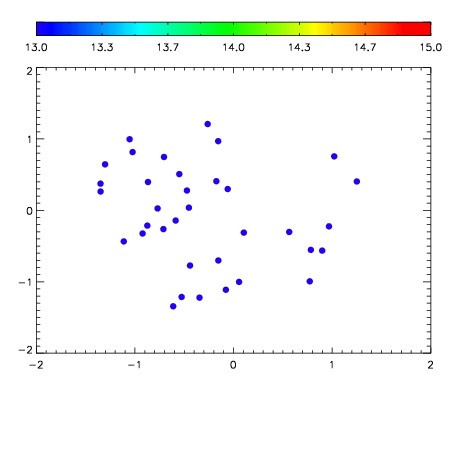

| Frame | Nreads | Zeropoints | Mag plots | Spatial mag deviation | Spatial sky 16325A emission deviations (filled: sky, open: star) | Spatial sky continuum emission | Spatial sky telluric CO2 absorption deviations (filled: H < 10) | |||||||||||||||||||||||
| 0 | 0 |
|
|
|
|
|
|
| IPAIR | NAME | SHIFT | NEWSHIFT | S/N | NAME | SHIFT | NEWSHIFT | S/N |
| 0 | 11650070 | 0.492616 | 0.00000 | 19.0054 | 11650068 | -0.00165452 | 0.494271 | 19.0356 |
| 1 | 11650067 | 0.492484 | 0.000131994 | 19.0076 | 11650069 | -0.00193590 | 0.494552 | 19.0716 |
| 2 | 11650071 | 0.492553 | 6.30021e-05 | 18.9796 | 11650072 | -0.00179195 | 0.494408 | 18.9731 |
| 3 | 11650066 | 0.491648 | 0.000968009 | 18.9526 | 11650065 | 0.00000 | 0.492616 | 18.8375 |