| Red | Green | Blue | |
| z | 17.64 | ||
| znorm | Inf | ||
| sky | -Inf | -Inf | -Inf |
| S/N | 27.1 | 46.6 | 50.8 |
| S/N(c) | 0.0 | 0.0 | 0.0 |
| SN(E/C) |
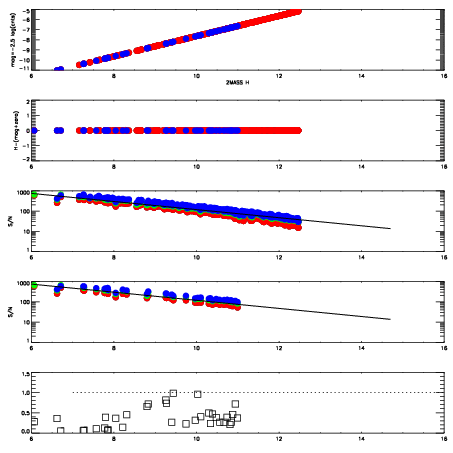


| Frame | Nreads | Zeropoints | Mag plots | Spatial mag deviation | Spatial sky 16325A emission deviations (filled: sky, open: star) | Spatial sky continuum emission | Spatial sky telluric CO2 absorption deviations (filled: H < 10) | |||||||||||||||||||||||
| 0 | 0 |
|
|
|
|
|
|
| IPAIR | NAME | SHIFT | NEWSHIFT | S/N | NAME | SHIFT | NEWSHIFT | S/N |
| 0 | 11950063 | 0.501190 | 0.00000 | 19.1267 | 11950061 | -0.00195742 | 0.503147 | 19.1294 |
| 1 | 11950064 | 0.501180 | 1.00136e-05 | 19.1149 | 11950062 | -0.00250631 | 0.503696 | 19.1193 |
| 2 | 11950060 | 0.500692 | 0.000497997 | 19.1081 | 11950065 | -0.00207398 | 0.503264 | 19.1049 |
| 3 | 11950059 | 0.499694 | 0.00149602 | 19.0705 | 11950058 | 0.00000 | 0.501190 | 18.9754 |