| Red | Green | Blue | |
| z | 17.64 | ||
| znorm | Inf | ||
| sky | -Inf | -NaN | -Inf |
| S/N | 16.6 | 30.5 | 32.1 |
| S/N(c) | 0.0 | 0.0 | 0.0 |
| SN(E/C) |
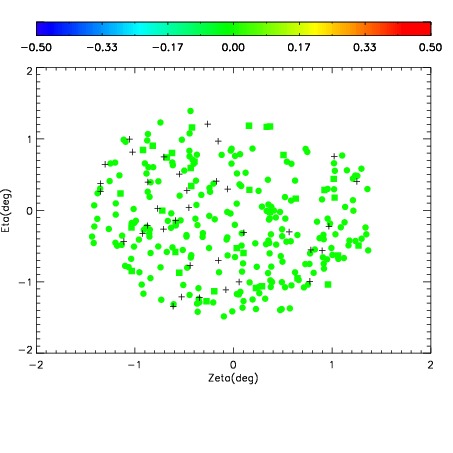
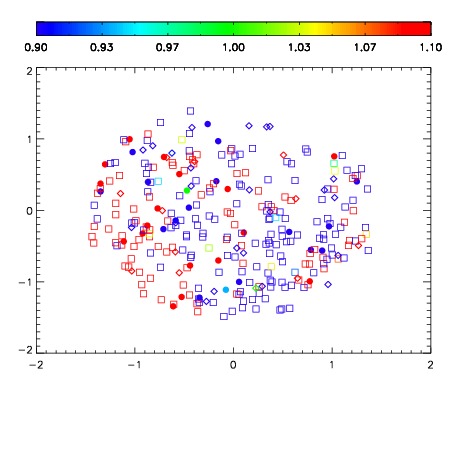


| Frame | Nreads | Zeropoints | Mag plots | Spatial mag deviation | Spatial sky 16325A emission deviations (filled: sky, open: star) | Spatial sky continuum emission | Spatial sky telluric CO2 absorption deviations (filled: H < 10) | |||||||||||||||||||||||
| 0 | 0 |
|
|
|
|
|
|
| IPAIR | NAME | SHIFT | NEWSHIFT | S/N | NAME | SHIFT | NEWSHIFT | S/N |
| 0 | 12030050 | 0.500196 | 0.00000 | 18.1316 | 12030048 | 0.00000 | 0.500196 | 18.2441 |
| 1 | 12030054 | 0.498418 | 0.00177798 | 18.7119 | 12030055 | 0.000147810 | 0.500048 | 18.7055 |
| 2 | 12030053 | 0.498226 | 0.00196999 | 18.6364 | 12030052 | -0.00367222 | 0.503868 | 18.6125 |
| 3 | 12030049 | 0.499669 | 0.000526994 | 18.2448 | 12030051 | -0.00333422 | 0.503530 | 18.4351 |