| Red | Green | Blue | |
| z | 17.64 | ||
| znorm | Inf | ||
| sky | -NaN | -NaN | -NaN |
| S/N | 21.2 | 39.7 | 42.0 |
| S/N(c) | 0.0 | 0.0 | 0.0 |
| SN(E/C) |
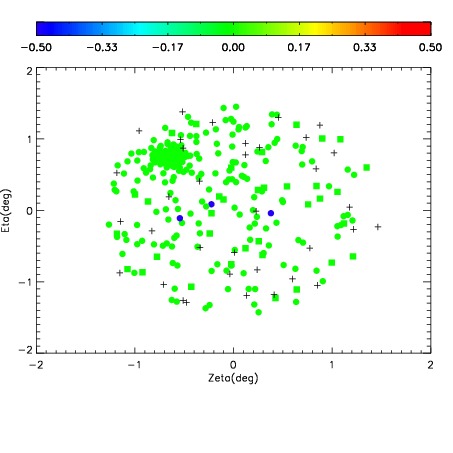
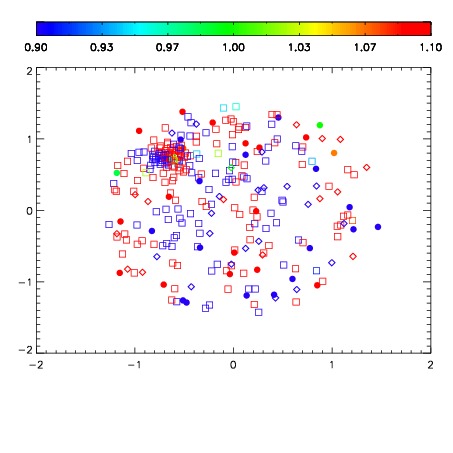


| Frame | Nreads | Zeropoints | Mag plots | Spatial mag deviation | Spatial sky 16325A emission deviations (filled: sky, open: star) | Spatial sky continuum emission | Spatial sky telluric CO2 absorption deviations (filled: H < 10) | |||||||||||||||||||||||
| 0 | 0 |
|
|
|
|
|
|
| IPAIR | NAME | SHIFT | NEWSHIFT | S/N | NAME | SHIFT | NEWSHIFT | S/N |
| 0 | 04670026 | 0.497644 | 0.00000 | 18.7776 | 04670029 | 0.00194600 | 0.495698 | 18.7162 |
| 1 | 04670027 | 0.497549 | 9.50098e-05 | 18.7782 | 04670025 | 0.00000 | 0.497644 | 18.9363 |
| 2 | 04670030 | 0.495947 | 0.00169700 | 18.6289 | 04670028 | 0.00298925 | 0.494655 | 18.6489 |
| 3 | 04670031 | 0.496821 | 0.000823021 | 18.5134 | 04670032 | 0.00168572 | 0.495958 | 18.4303 |