| Red | Green | Blue | |
| z | 17.64 | ||
| znorm | Inf | ||
| sky | -Inf | -Inf | -Inf |
| S/N | 25.3 | 46.0 | 49.5 |
| S/N(c) | 0.0 | 0.0 | 0.0 |
| SN(E/C) |

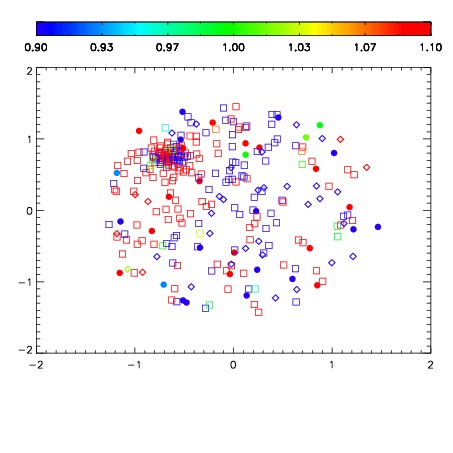


| Frame | Nreads | Zeropoints | Mag plots | Spatial mag deviation | Spatial sky 16325A emission deviations (filled: sky, open: star) | Spatial sky continuum emission | Spatial sky telluric CO2 absorption deviations (filled: H < 10) | |||||||||||||||||||||||
| 0 | 0 |
|
|
|
|
|
|
| IPAIR | NAME | SHIFT | NEWSHIFT | S/N | NAME | SHIFT | NEWSHIFT | S/N |
| 0 | 04870049 | 0.502581 | 0.00000 | 19.0228 | 04870051 | -0.000439320 | 0.503020 | 19.0901 |
| 1 | 04870054 | 0.499523 | 0.00305799 | 19.0277 | 04870055 | 0.000536279 | 0.502045 | 19.1143 |
| 2 | 04870053 | 0.498919 | 0.00366199 | 19.0221 | 04870052 | -0.000628353 | 0.503209 | 19.0665 |
| 3 | 04870050 | 0.502295 | 0.000285983 | 19.0169 | 04870048 | 0.00000 | 0.502581 | 19.0426 |