| Red | Green | Blue | |
| z | 17.64 | ||
| znorm | Inf | ||
| sky | -Inf | -NaN | -Inf |
| S/N | 34.3 | 60.0 | 65.1 |
| S/N(c) | 0.0 | 0.0 | 0.0 |
| SN(E/C) |

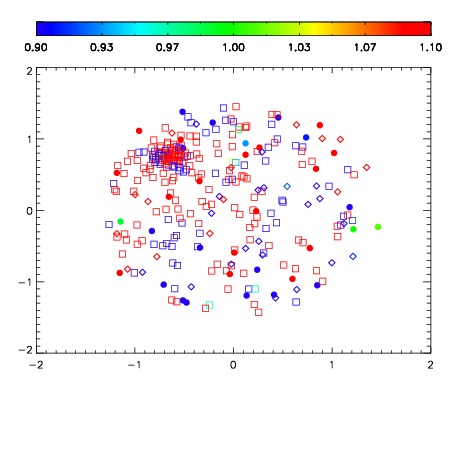


| Frame | Nreads | Zeropoints | Mag plots | Spatial mag deviation | Spatial sky 16325A emission deviations (filled: sky, open: star) | Spatial sky continuum emission | Spatial sky telluric CO2 absorption deviations (filled: H < 10) | |||||||||||||||||||||||
| 0 | 0 |
|
|
|
|
|
|
| IPAIR | NAME | SHIFT | NEWSHIFT | S/N | NAME | SHIFT | NEWSHIFT | S/N |
| 0 | 07530100 | 0.482582 | 0.00000 | 18.9703 | 07530105 | 0.00339008 | 0.479192 | 19.0310 |
| 1 | 07530096 | 0.480956 | 0.00162601 | 19.0099 | 07530094 | 0.00000 | 0.482582 | 19.0668 |
| 2 | 07530103 | 0.479512 | 0.00307000 | 18.9658 | 07530106 | 0.00494246 | 0.477640 | 18.9512 |
| 3 | 07530095 | 0.480007 | 0.00257501 | 18.9526 | 07530102 | 0.00476130 | 0.477821 | 18.9359 |
| 4 | 07530104 | 0.480828 | 0.00175402 | 18.9429 | 07530101 | 0.00448236 | 0.478100 | 18.9225 |
| 5 | 07530107 | 0.479690 | 0.00289202 | 18.9302 | 07530097 | 0.00234054 | 0.480241 | 18.9155 |
| 6 | 07530099 | 0.481995 | 0.000587016 | 18.8139 | 07530098 | 0.00133431 | 0.481248 | 18.7268 |