| Red | Green | Blue | |
| z | 17.63 | ||
| znorm | Inf | ||
| sky | -NaN | -NaN | -Inf |
| S/N | 24.1 | 42.8 | 48.2 |
| S/N(c) | 0.0 | 0.0 | 0.0 |
| SN(E/C) |
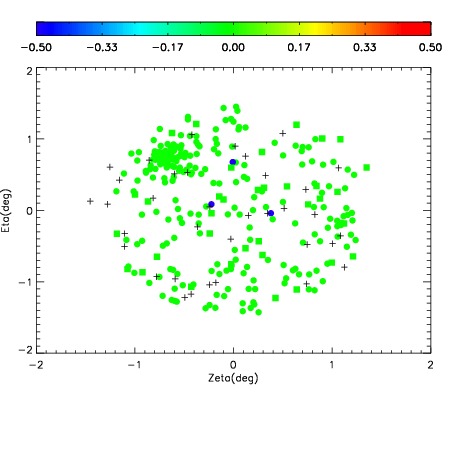

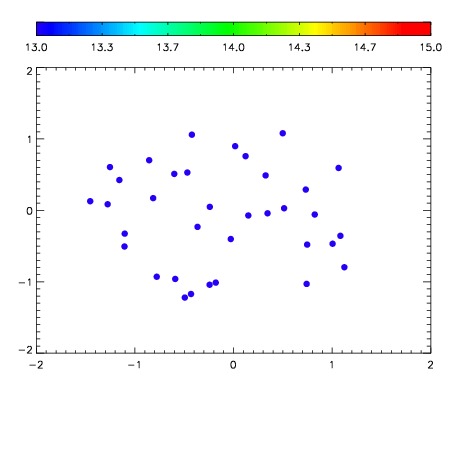

| Frame | Nreads | Zeropoints | Mag plots | Spatial mag deviation | Spatial sky 16325A emission deviations (filled: sky, open: star) | Spatial sky continuum emission | Spatial sky telluric CO2 absorption deviations (filled: H < 10) | |||||||||||||||||||||||
| 0 | 0 |
|
|
|
|
|
|
| IPAIR | NAME | SHIFT | NEWSHIFT | S/N | NAME | SHIFT | NEWSHIFT | S/N |
| 0 | 05490017 | 0.487186 | 0.00000 | 18.9139 | 05490014 | 0.000858670 | 0.486327 | 18.9155 |
| 1 | 05490016 | 0.487141 | 4.50015e-05 | 18.9278 | 05490018 | 0.000205210 | 0.486981 | 18.9440 |
| 2 | 05490012 | 0.486818 | 0.000368029 | 18.8782 | 05490015 | -0.000413928 | 0.487600 | 18.8579 |
| 3 | 05490013 | 0.486565 | 0.000621021 | 18.8481 | 05490011 | 0.00000 | 0.487186 | 18.8463 |