| Red | Green | Blue | |
| z | 17.64 | ||
| znorm | Inf | ||
| sky | -Inf | -Inf | -Inf |
| S/N | 34.3 | 59.4 | 64.3 |
| S/N(c) | 0.0 | 0.0 | 0.0 |
| SN(E/C) |

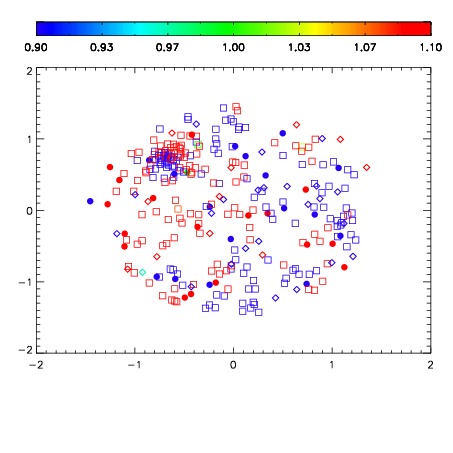
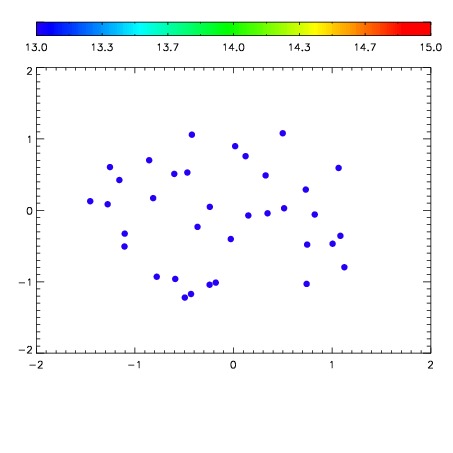

| Frame | Nreads | Zeropoints | Mag plots | Spatial mag deviation | Spatial sky 16325A emission deviations (filled: sky, open: star) | Spatial sky continuum emission | Spatial sky telluric CO2 absorption deviations (filled: H < 10) | |||||||||||||||||||||||
| 0 | 0 |
|
|
|
|
|
|
| IPAIR | NAME | SHIFT | NEWSHIFT | S/N | NAME | SHIFT | NEWSHIFT | S/N |
| 0 | 07540102 | 0.475063 | 0.00000 | 19.1371 | 07540107 | 0.00311285 | 0.471950 | 19.1613 |
| 1 | 07540101 | 0.474600 | 0.000463009 | 19.1834 | 07540100 | 0.00431240 | 0.470751 | 19.1798 |
| 2 | 07540105 | 0.473593 | 0.00147000 | 19.1668 | 07540104 | 0.000778870 | 0.474284 | 19.1647 |
| 3 | 07540106 | 0.473829 | 0.00123399 | 19.1396 | 07540099 | -0.00882175 | 0.483885 | 19.1626 |
| 4 | 07540097 | 0.473687 | 0.00137600 | 19.1136 | 07540103 | 0.00760472 | 0.467458 | 19.1391 |
| 5 | 07540098 | 0.474836 | 0.000227004 | 19.0908 | 07540096 | 0.00000 | 0.475063 | 19.0682 |