| Red | Green | Blue | |
| z | 17.63 | ||
| znorm | Inf | ||
| sky | -NaN | -NaN | -Inf |
| S/N | 29.6 | 53.6 | 56.5 |
| S/N(c) | 0.0 | 0.0 | 0.0 |
| SN(E/C) |
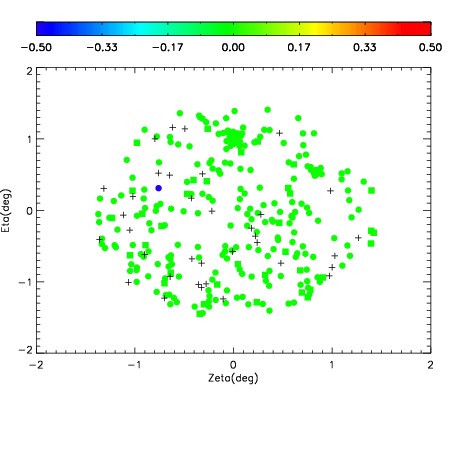
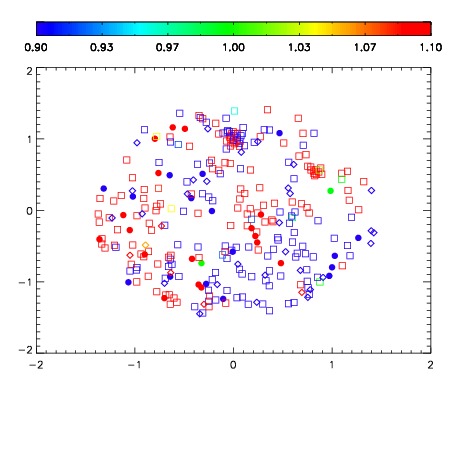
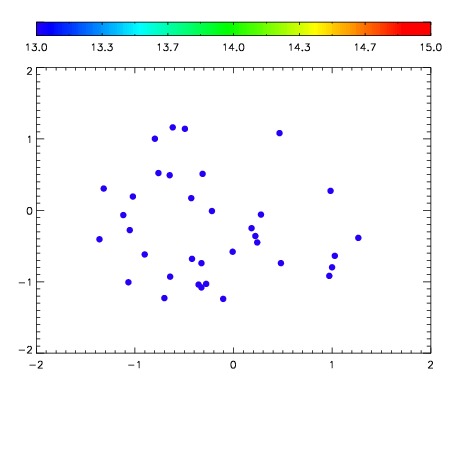

| Frame | Nreads | Zeropoints | Mag plots | Spatial mag deviation | Spatial sky 16325A emission deviations (filled: sky, open: star) | Spatial sky continuum emission | Spatial sky telluric CO2 absorption deviations (filled: H < 10) | |||||||||||||||||||||||
| 0 | 0 |
|
|
|
|
|
|
| IPAIR | NAME | SHIFT | NEWSHIFT | S/N | NAME | SHIFT | NEWSHIFT | S/N |
| 0 | 03710108 | 0.511228 | 0.00000 | 19.1317 | 03710098 | 0.00000 | 0.511228 | 19.0801 |
| 1 | 03710100 | 0.503721 | 0.00750703 | 19.1515 | 03710102 | 0.00167363 | 0.509554 | 19.0948 |
| 2 | 03710099 | 0.502227 | 0.00900102 | 19.1233 | 03710101 | 0.00258206 | 0.508646 | 19.0638 |
| 3 | 03710107 | 0.504850 | 0.00637805 | 19.0917 | 03710109 | 0.00498347 | 0.506245 | 18.9952 |
| 4 | 03710104 | 0.507707 | 0.00352103 | 19.0810 | 03710106 | 0.00476560 | 0.506462 | 18.9835 |
| 5 | 03710103 | 0.499230 | 0.0119980 | 19.0506 | 03710105 | 0.00281605 | 0.508412 | 18.9225 |