| Red | Green | Blue | |
| z | 17.63 | ||
| znorm | Inf | ||
| sky | -NaN | -NaN | -Inf |
| S/N | 26.8 | 46.8 | 49.7 |
| S/N(c) | 0.0 | 0.0 | 0.0 |
| SN(E/C) |
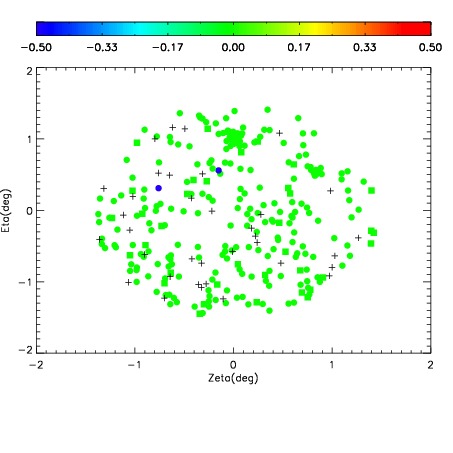
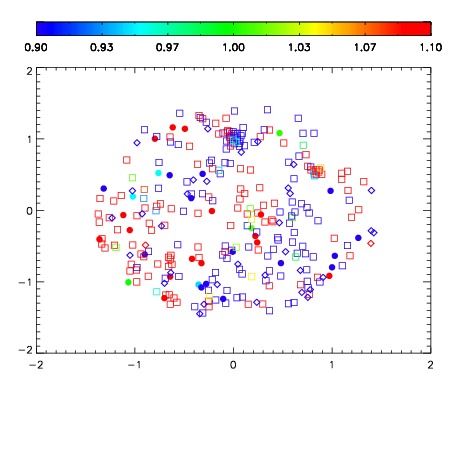


| Frame | Nreads | Zeropoints | Mag plots | Spatial mag deviation | Spatial sky 16325A emission deviations (filled: sky, open: star) | Spatial sky continuum emission | Spatial sky telluric CO2 absorption deviations (filled: H < 10) | |||||||||||||||||||||||
| 0 | 0 |
|
|
|
|
|
|
| IPAIR | NAME | SHIFT | NEWSHIFT | S/N | NAME | SHIFT | NEWSHIFT | S/N |
| 0 | 04900053 | 0.485423 | 0.00000 | 19.0818 | 04900054 | -0.00165924 | 0.487082 | 19.0953 |
| 1 | 04900049 | 0.484453 | 0.000970006 | 19.1431 | 04900050 | -0.00111466 | 0.486538 | 19.1764 |
| 2 | 04900052 | 0.484996 | 0.000427008 | 19.1078 | 04900051 | -0.00135812 | 0.486781 | 19.1614 |
| 3 | 04900048 | 0.484130 | 0.00129300 | 18.9382 | 04900047 | 0.00000 | 0.485423 | 19.0237 |