| Red | Green | Blue | |
| z | 17.63 | ||
| znorm | Inf | ||
| sky | -NaN | -NaN | -Inf |
| S/N | 30.9 | 54.9 | 61.3 |
| S/N(c) | 0.0 | 0.0 | 0.0 |
| SN(E/C) |
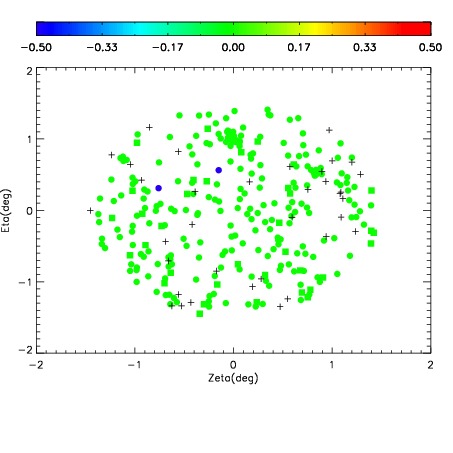
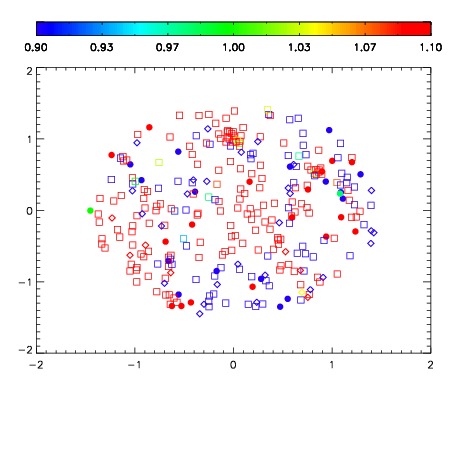
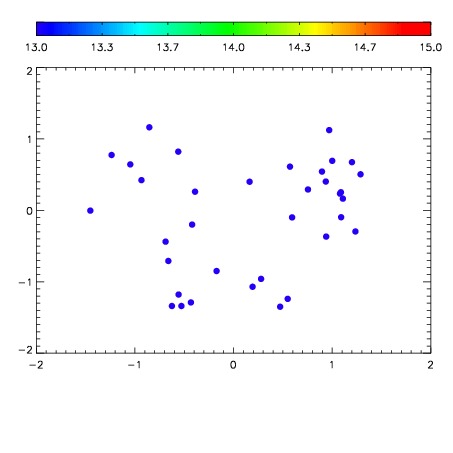

| Frame | Nreads | Zeropoints | Mag plots | Spatial mag deviation | Spatial sky 16325A emission deviations (filled: sky, open: star) | Spatial sky continuum emission | Spatial sky telluric CO2 absorption deviations (filled: H < 10) | |||||||||||||||||||||||
| 0 | 0 |
|
|
|
|
|
|
| IPAIR | NAME | SHIFT | NEWSHIFT | S/N | NAME | SHIFT | NEWSHIFT | S/N |
| 0 | 04050092 | 0.503547 | 0.00000 | 18.9875 | 04050086 | 0.00197891 | 0.501568 | 19.0368 |
| 1 | 04050084 | 0.498240 | 0.00530702 | 19.0676 | 04050085 | 0.00169628 | 0.501851 | 19.0756 |
| 2 | 04050083 | 0.496314 | 0.00723302 | 19.0568 | 04050090 | 0.00192687 | 0.501620 | 19.0425 |
| 3 | 04050087 | 0.499229 | 0.00431800 | 19.0012 | 04050093 | 0.00353168 | 0.500015 | 19.0402 |
| 4 | 04050091 | 0.502847 | 0.000699997 | 18.9524 | 04050082 | 0.00000 | 0.503547 | 19.0290 |
| 5 | 04050088 | 0.500568 | 0.00297904 | 18.9486 | 04050089 | 0.00308528 | 0.500462 | 18.9500 |