| Red | Green | Blue | |
| z | 17.64 | ||
| znorm | Inf | ||
| sky | -Inf | -Inf | -Inf |
| S/N | 26.3 | 45.2 | 49.7 |
| S/N(c) | 0.0 | 0.0 | 0.0 |
| SN(E/C) |
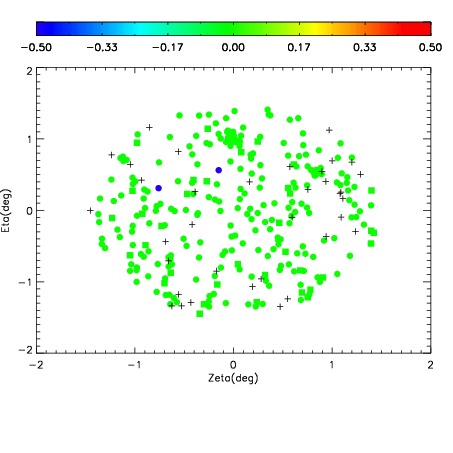
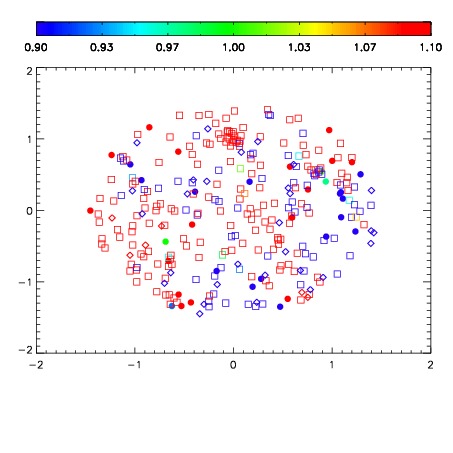
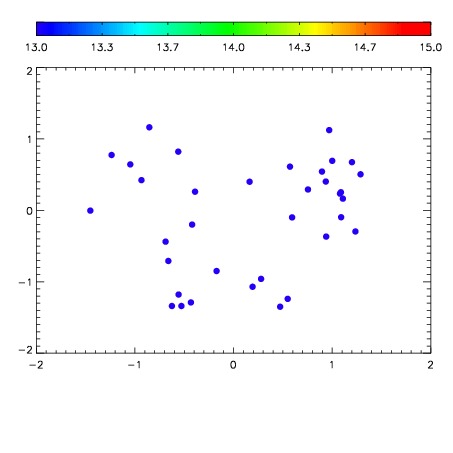

| Frame | Nreads | Zeropoints | Mag plots | Spatial mag deviation | Spatial sky 16325A emission deviations (filled: sky, open: star) | Spatial sky continuum emission | Spatial sky telluric CO2 absorption deviations (filled: H < 10) | |||||||||||||||||||||||
| 0 | 0 |
|
|
|
|
|
|
| IPAIR | NAME | SHIFT | NEWSHIFT | S/N | NAME | SHIFT | NEWSHIFT | S/N |
| 0 | 05150019 | 0.501419 | 0.00000 | 19.1753 | 05150020 | 0.00296251 | 0.498457 | 19.1786 |
| 1 | 05150018 | 0.500179 | 0.00124002 | 19.1363 | 05150017 | 0.000525282 | 0.500894 | 19.1154 |
| 2 | 05150015 | 0.499710 | 0.00170901 | 19.1305 | 05150016 | 0.00184296 | 0.499576 | 19.0985 |
| 3 | 05150014 | 0.499341 | 0.00207800 | 19.1291 | 05150013 | 0.00000 | 0.501419 | 19.0799 |