| Red | Green | Blue | |
| z | 17.64 | ||
| znorm | Inf | ||
| sky | -Inf | -Inf | -Inf |
| S/N | 23.5 | 41.7 | 46.2 |
| S/N(c) | 0.0 | 0.0 | 0.0 |
| SN(E/C) |
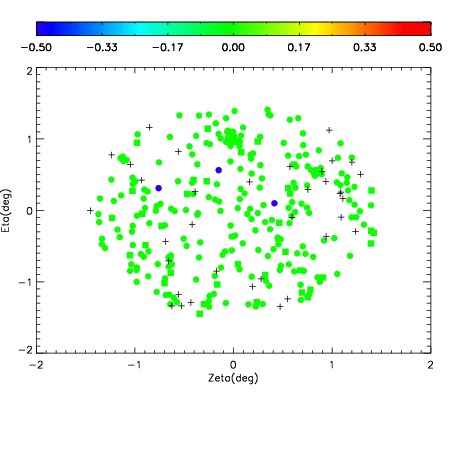
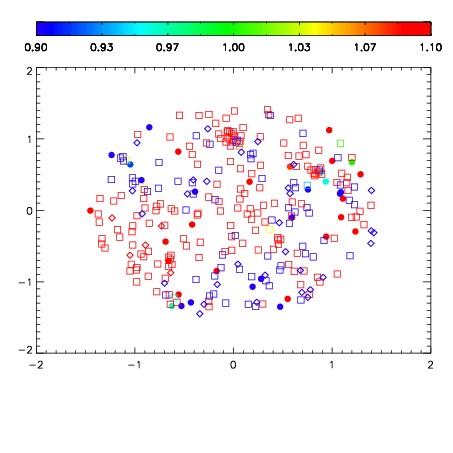


| Frame | Nreads | Zeropoints | Mag plots | Spatial mag deviation | Spatial sky 16325A emission deviations (filled: sky, open: star) | Spatial sky continuum emission | Spatial sky telluric CO2 absorption deviations (filled: H < 10) | |||||||||||||||||||||||
| 0 | 0 |
|
|
|
|
|
|
| IPAIR | NAME | SHIFT | NEWSHIFT | S/N | NAME | SHIFT | NEWSHIFT | S/N |
| 0 | 05190032 | 0.494349 | 0.00000 | 19.0097 | 05190026 | 0.00000 | 0.494349 | 19.0020 |
| 1 | 05190027 | 0.492749 | 0.00160000 | 19.0223 | 05190033 | -5.24790e-05 | 0.494401 | 19.1010 |
| 2 | 05190028 | 0.493434 | 0.000914991 | 18.8351 | 05190030 | -0.000953493 | 0.495302 | 18.8929 |
| 3 | 05190031 | 0.493544 | 0.000804991 | 18.6967 | 05190029 | -0.00106642 | 0.495415 | 18.7798 |