| Red | Green | Blue | |
| z | 17.63 | ||
| znorm | Inf | ||
| sky | -NaN | -NaN | -NaN |
| S/N | 23.7 | 41.7 | 44.6 |
| S/N(c) | 0.0 | 0.0 | 0.0 |
| SN(E/C) |
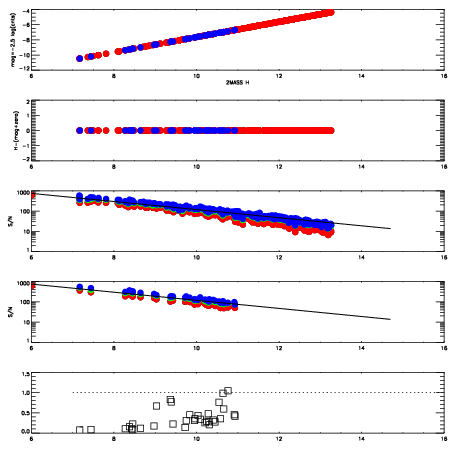
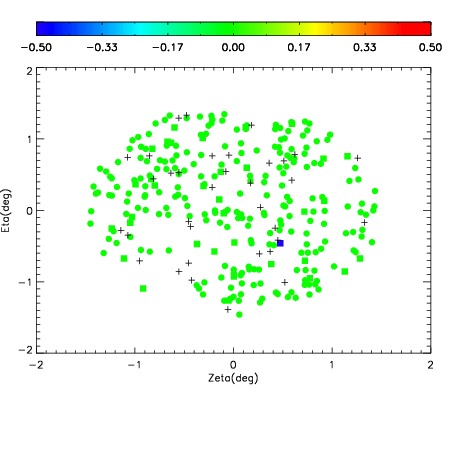
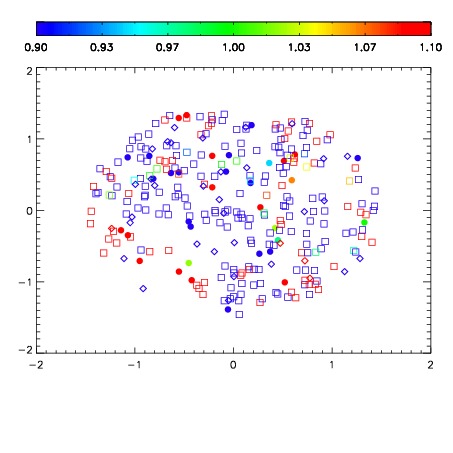


| Frame | Nreads | Zeropoints | Mag plots | Spatial mag deviation | Spatial sky 16325A emission deviations (filled: sky, open: star) | Spatial sky continuum emission | Spatial sky telluric CO2 absorption deviations (filled: H < 10) | |||||||||||||||||||||||
| 0 | 0 |
|
|
|
|
|
|
| IPAIR | NAME | SHIFT | NEWSHIFT | S/N | NAME | SHIFT | NEWSHIFT | S/N |
| 0 | 04300031 | 0.492879 | 0.00000 | 18.8800 | 04300029 | 0.000774254 | 0.492105 | 18.7948 |
| 1 | 04300027 | 0.491116 | 0.00176302 | 19.0989 | 04300025 | 0.00000 | 0.492879 | 19.0210 |
| 2 | 04300026 | 0.490207 | 0.00267202 | 19.0480 | 04300032 | 0.00133812 | 0.491541 | 18.9975 |
| 3 | 04300030 | 0.492176 | 0.000703007 | 18.1321 | 04300028 | 0.00111937 | 0.491760 | 18.6249 |