| Red | Green | Blue | |
| z | 17.64 | ||
| znorm | Inf | ||
| sky | -Inf | -Inf | -Inf |
| S/N | 25.4 | 45.7 | 50.1 |
| S/N(c) | 0.0 | 0.0 | 0.0 |
| SN(E/C) |


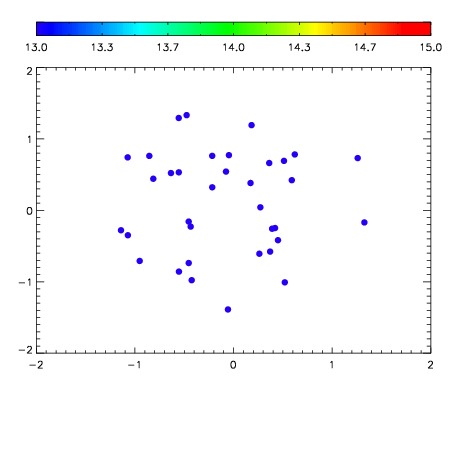

| Frame | Nreads | Zeropoints | Mag plots | Spatial mag deviation | Spatial sky 16325A emission deviations (filled: sky, open: star) | Spatial sky continuum emission | Spatial sky telluric CO2 absorption deviations (filled: H < 10) | |||||||||||||||||||||||
| 0 | 0 |
|
|
|
|
|
|
| IPAIR | NAME | SHIFT | NEWSHIFT | S/N | NAME | SHIFT | NEWSHIFT | S/N |
| 0 | 04860045 | 0.496370 | 0.00000 | 19.0444 | 04860043 | 0.00151894 | 0.494851 | 19.0210 |
| 1 | 04860041 | 0.493628 | 0.00274199 | 19.0224 | 04860046 | 0.00692743 | 0.489443 | 19.0109 |
| 2 | 04860040 | 0.492165 | 0.00420499 | 19.0184 | 04860042 | 0.00403293 | 0.492337 | 19.0060 |
| 3 | 04860044 | 0.495148 | 0.00122198 | 19.0020 | 04860039 | 0.00000 | 0.496370 | 18.9846 |