| Red | Green | Blue | |
| z | 17.64 | ||
| znorm | Inf | ||
| sky | -Inf | -NaN | -Inf |
| S/N | 28.6 | 46.8 | 50.7 |
| S/N(c) | 0.0 | 0.0 | 0.0 |
| SN(E/C) |

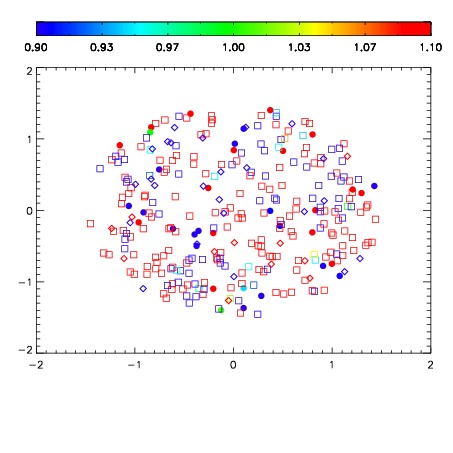


| Frame | Nreads | Zeropoints | Mag plots | Spatial mag deviation | Spatial sky 16325A emission deviations (filled: sky, open: star) | Spatial sky continuum emission | Spatial sky telluric CO2 absorption deviations (filled: H < 10) | |||||||||||||||||||||||
| 0 | 0 |
|
|
|
|
|
|
| IPAIR | NAME | SHIFT | NEWSHIFT | S/N | NAME | SHIFT | NEWSHIFT | S/N |
| 0 | 04870042 | 0.500981 | 0.00000 | 19.0965 | 04870041 | -0.00239996 | 0.503381 | 19.0871 |
| 1 | 04870043 | 0.500032 | 0.000948966 | 19.1187 | 04870044 | -0.00293498 | 0.503916 | 19.1050 |
| 2 | 04870039 | 0.496379 | 0.00460199 | 19.1162 | 04870040 | -0.00108740 | 0.502068 | 19.0883 |
| 3 | 04870038 | 0.496224 | 0.00475699 | 19.0847 | 04870037 | 0.00000 | 0.500981 | 19.0843 |