| Red | Green | Blue | |
| z | 17.64 | ||
| znorm | Inf | ||
| sky | -Inf | -Inf | -Inf |
| S/N | 29.7 | 49.7 | 52.5 |
| S/N(c) | 0.0 | 0.0 | 0.0 |
| SN(E/C) |


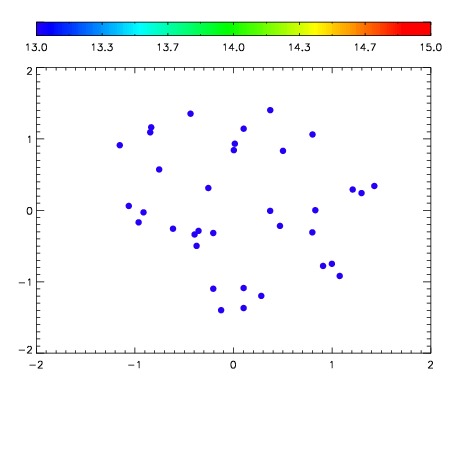

| Frame | Nreads | Zeropoints | Mag plots | Spatial mag deviation | Spatial sky 16325A emission deviations (filled: sky, open: star) | Spatial sky continuum emission | Spatial sky telluric CO2 absorption deviations (filled: H < 10) | |||||||||||||||||||||||
| 0 | 0 |
|
|
|
|
|
|
| IPAIR | NAME | SHIFT | NEWSHIFT | S/N | NAME | SHIFT | NEWSHIFT | S/N |
| 0 | 04920034 | 0.487839 | 0.00000 | 19.1643 | 04920035 | 0.00160002 | 0.486239 | 19.1784 |
| 1 | 04920037 | 0.487039 | 0.000800014 | 19.1826 | 04920036 | -0.00376463 | 0.491604 | 19.1865 |
| 2 | 04920038 | 0.487702 | 0.000137001 | 19.1568 | 04920039 | -0.00310494 | 0.490944 | 19.1687 |
| 3 | 04920033 | 0.487420 | 0.000419021 | 19.1333 | 04920032 | 0.00000 | 0.487839 | 19.1300 |