| Frame | Nreads | Zeropoints | Mag plots
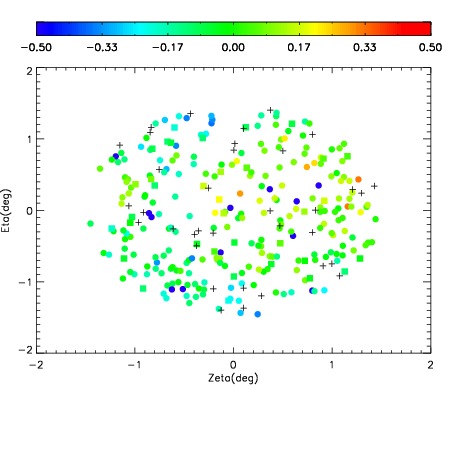
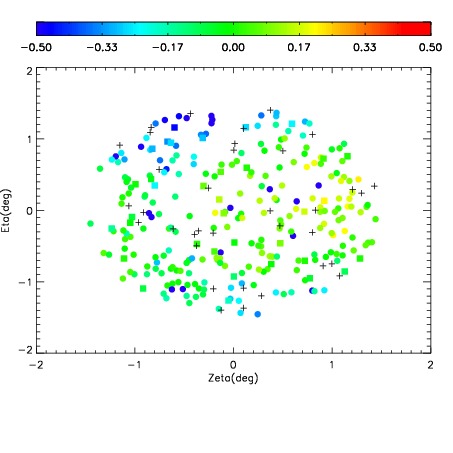
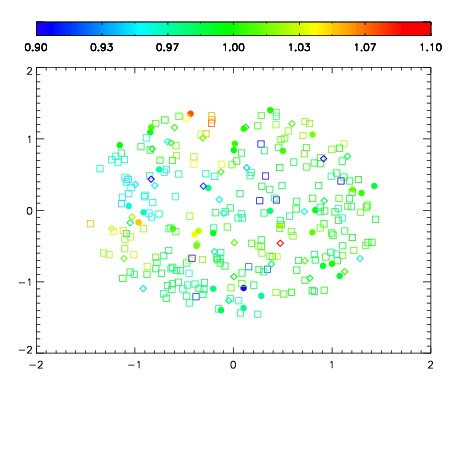
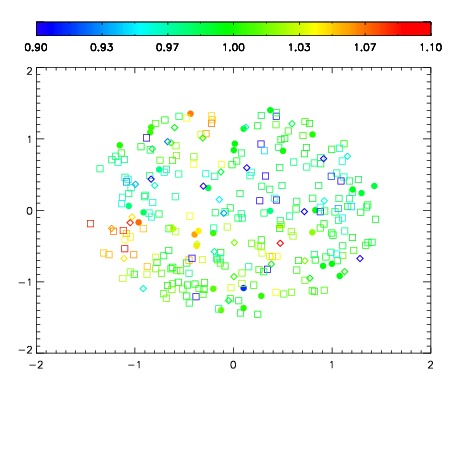
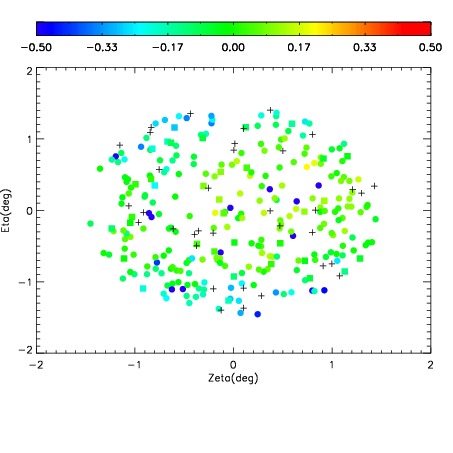
| Spatial mag deviation
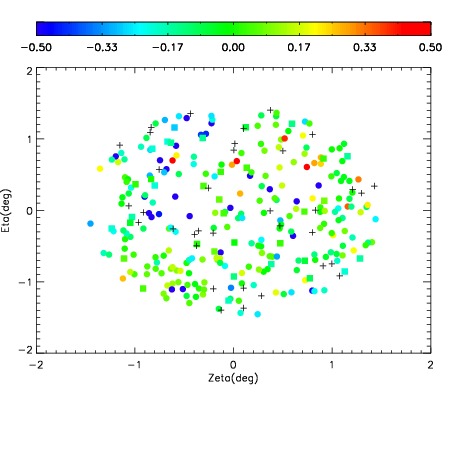
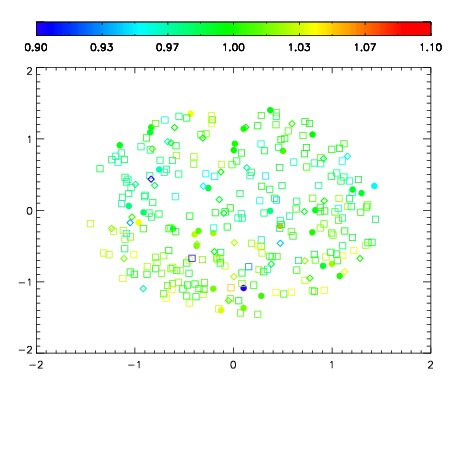
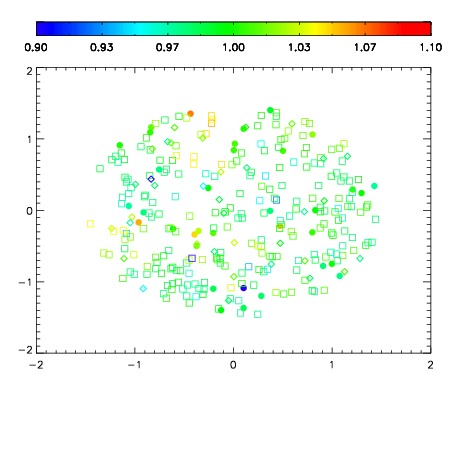
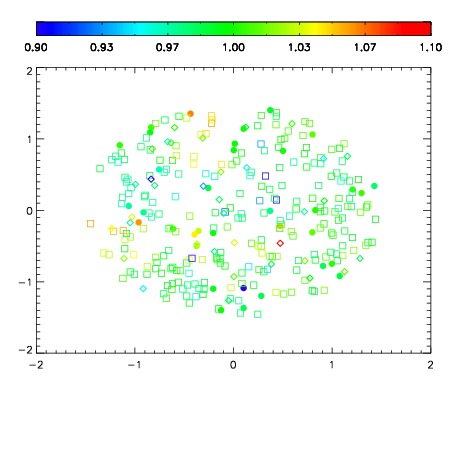
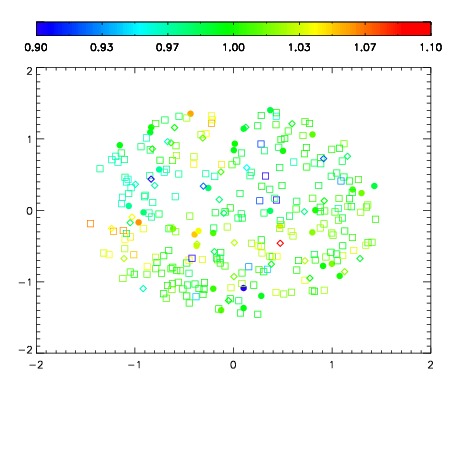
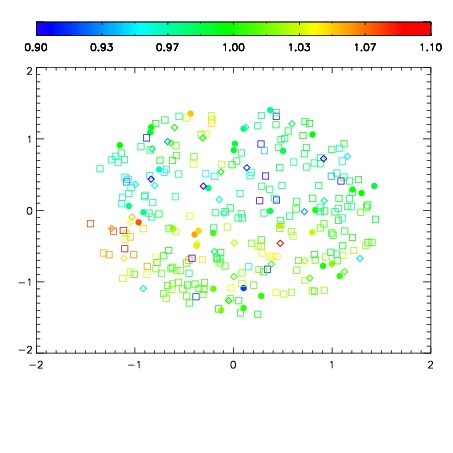
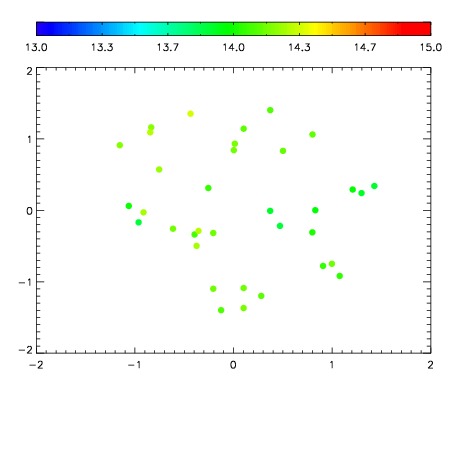
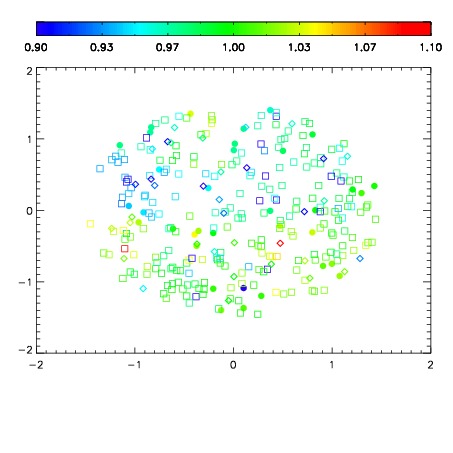
| Spatial sky 16325A emission deviations (filled: sky, open: star)
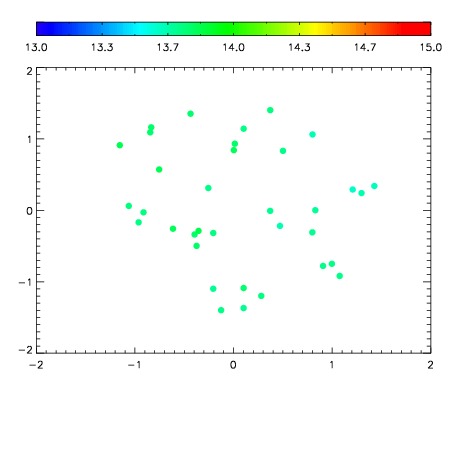
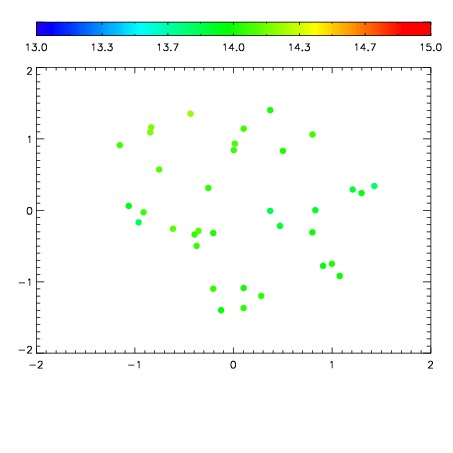
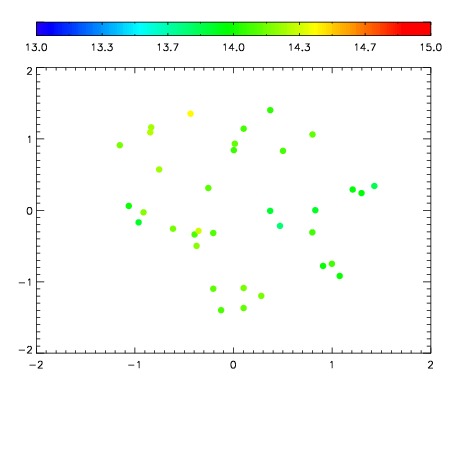
| Spatial sky continuum emission
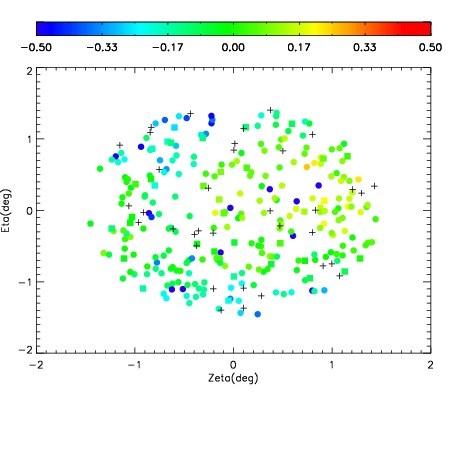
| Spatial sky telluric CO2 absorption deviations (filled: H < 10)
|
| 5210011
| 47
| | Red | Green | Blue
| | z | | 16.37
| | znorm | | 12.19
| | sky | 14.0 | 13.7 | 13.8
| | S/N | 1.9 | 3.7 | 4.3
| | S/N(c) | 1.5 | 3.1 | 5.7
| | SN(E/C) 0.90
|
| 
| 
| 
| 
| 
|
| 5210012
| 47
| | Red | Green | Blue
| | z | | 16.73
| | znorm | | 12.55
| | sky | 13.7 | 13.7 | 13.9
| | S/N | 2.2 | 4.5 | 5.2
| | S/N(c) | 1.9 | 4.0 | 7.5
| | SN(E/C) 0.88
|
| 
| 
| 
| 
| 
|
| 5210013
| 47
| | Red | Green | Blue
| | z | | 17.32
| | znorm | | 13.14
| | sky | 13.9 | 13.7 | 13.9
| | S/N | 4.0 | 7.5 | 8.1
| | S/N(c) | 3.1 | 5.9 | 11.4
| | SN(E/C) 0.81
|
| 
| 
| 
| 
| 
|
| 5210014
| 47
| | Red | Green | Blue
| | z | | 17.75
| | znorm | | 13.57
| | sky | 13.8 | 13.7 | 13.8
| | S/N | 5.6 | 10.5 | 10.9
| | S/N(c) | 4.1 | 7.5 | 14.7
| | SN(E/C) 0.71
|
| 
| 
| 
| 
| 
|
| 5210015
| 47
| | Red | Green | Blue
| | z | | 18.05
| | znorm | | 13.87
| | sky | 13.7 | 13.7 | 13.7
| | S/N | 7.2 | 12.7 | 13.3
| | S/N(c) | 5.1 | 9.3 | 18.3
| | SN(E/C) 0.63
|
| 
| 
| 
| 
| 
|
| 5210016
| 47
| | Red | Green | Blue
| | z | | 18.53
| | znorm | | 14.35
| | sky | 14.0 | 14.0 | 14.0
| | S/N | 10.7 | 18.0 | 19.1
| | S/N(c) | 7.1 | 11.9 | 23.8
| | SN(E/C) 0.54
|
| 
| 
| 
| 
| 
|
| 5210017
| 47
| | Red | Green | Blue
| | z | | 18.90
| | znorm | | 14.72
| | sky | 14.2 | 14.1 | 14.1
| | S/N | 14.0 | 22.7 | 24.1
| | S/N(c) | 8.9 | 14.1 | 28.0
| | SN(E/C) 0.45
|
| 
| 
| 
| 
| 
|
| 5210018
| 47
| | Red | Green | Blue
| | z | | 18.99
| | znorm | | 14.81
| | sky | 14.1 | 14.1 | 14.1
| | S/N | 14.6 | 23.8 | 25.2
| | S/N(c) | 9.3 | 14.9 | 29.3
| | SN(E/C) 0.45
|
| 
| 
| 
| 
| 
|