| Red | Green | Blue | |
| z | 17.64 | ||
| znorm | Inf | ||
| sky | -Inf | -Inf | -Inf |
| S/N | 15.4 | 26.7 | 29.8 |
| S/N(c) | 0.0 | 0.0 | 0.0 |
| SN(E/C) |

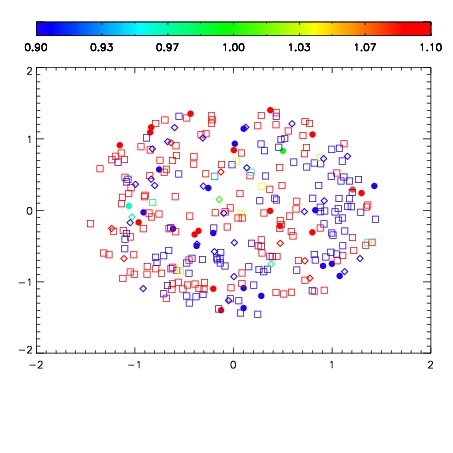


| Frame | Nreads | Zeropoints | Mag plots | Spatial mag deviation | Spatial sky 16325A emission deviations (filled: sky, open: star) | Spatial sky continuum emission | Spatial sky telluric CO2 absorption deviations (filled: H < 10) | |||||||||||||||||||||||
| 0 | 0 |
|
|
|
|
|
|
| IPAIR | NAME | SHIFT | NEWSHIFT | S/N | NAME | SHIFT | NEWSHIFT | S/N |
| 0 | 05210012 | 0.494284 | 0.00000 | 16.7150 | 05210011 | 0.00000 | 0.494284 | 16.3732 |
| 1 | 05210017 | 0.494246 | 3.79980e-05 | 18.8855 | 05210018 | -2.45491e-05 | 0.494309 | 18.9705 |
| 2 | 05210016 | 0.493533 | 0.000751019 | 18.5137 | 05210015 | -0.00246365 | 0.496748 | 18.0382 |
| 3 | 05210013 | 0.494064 | 0.000220001 | 17.3115 | 05210014 | -0.00128413 | 0.495568 | 17.7477 |