| Red | Green | Blue | |
| z | 17.64 | ||
| znorm | Inf | ||
| sky | -Inf | -Inf | -Inf |
| S/N | 36.6 | 62.6 | 71.1 |
| S/N(c) | 0.0 | 0.0 | 0.0 |
| SN(E/C) |
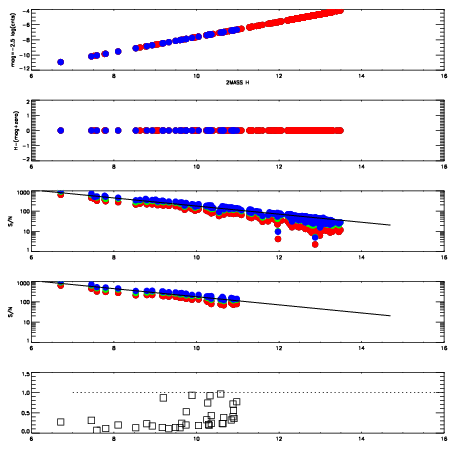
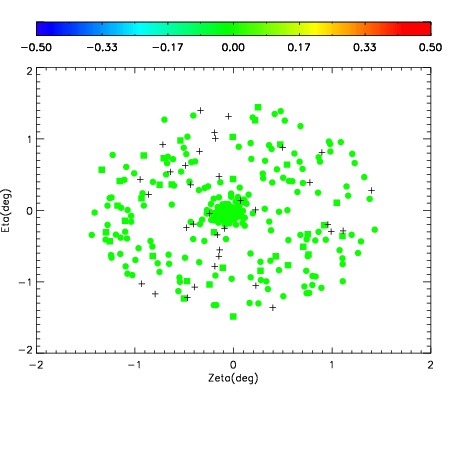
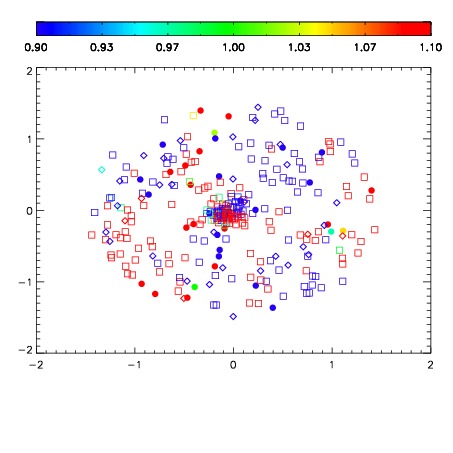


| Frame | Nreads | Zeropoints | Mag plots | Spatial mag deviation | Spatial sky 16325A emission deviations (filled: sky, open: star) | Spatial sky continuum emission | Spatial sky telluric CO2 absorption deviations (filled: H < 10) | |||||||||||||||||||||||
| 0 | 0 |
|
|
|
|
|
|
| IPAIR | NAME | SHIFT | NEWSHIFT | S/N | NAME | SHIFT | NEWSHIFT | S/N |
| 0 | 04290080 | 0.508674 | 0.00000 | 18.7431 | 04290082 | 0.00371537 | 0.504959 | 18.7978 |
| 1 | 04290095 | 0.503091 | 0.00558305 | 18.8877 | 04290078 | 0.00000 | 0.508674 | 18.9168 |
| 2 | 04290084 | 0.506299 | 0.00237501 | 18.8125 | 04290094 | 0.00284994 | 0.505824 | 18.8128 |
| 3 | 04290079 | 0.498400 | 0.0102740 | 18.8085 | 04290093 | 0.00245112 | 0.506223 | 18.8062 |
| 4 | 04290083 | 0.498871 | 0.00980303 | 18.7360 | 04290081 | 0.000764724 | 0.507909 | 18.7970 |
| 5 | 04290092 | 0.503499 | 0.00517505 | 18.7014 | 04290089 | 0.00312324 | 0.505551 | 18.7939 |
| 6 | 04290091 | 0.502460 | 0.00621402 | 18.7007 | 04290090 | 0.00176757 | 0.506906 | 18.7846 |
| 7 | 04290088 | 0.499959 | 0.00871503 | 18.6817 | 04290085 | 0.00148163 | 0.507192 | 18.7833 |
| 8 | 04290087 | 0.499317 | 0.00935704 | 18.6599 | 04290086 | 0.00171285 | 0.506961 | 18.7436 |