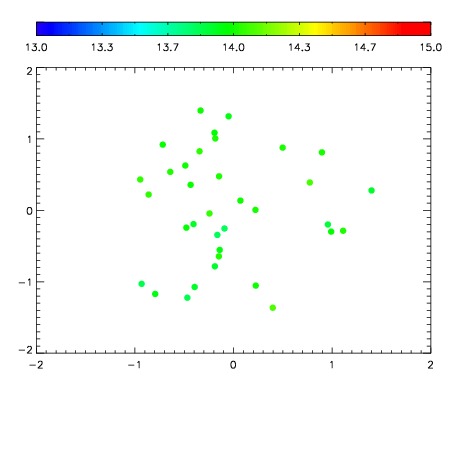
| Frame | Nreads | Zeropoints | Mag plots
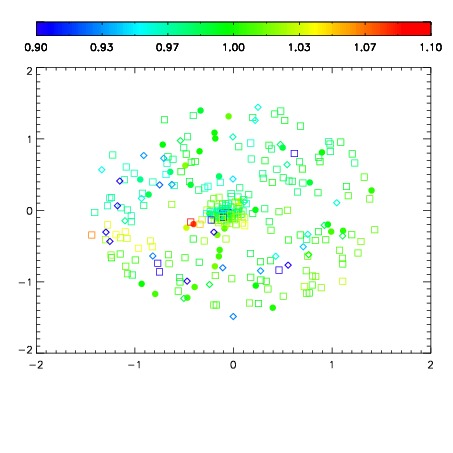
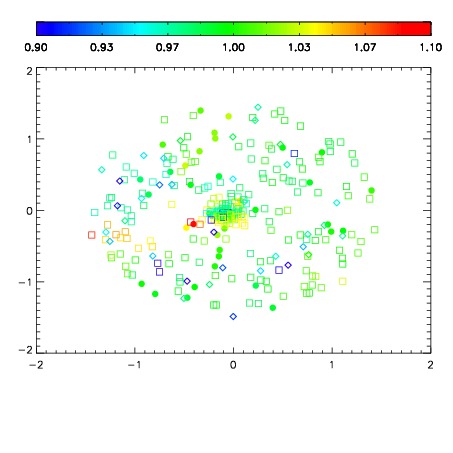
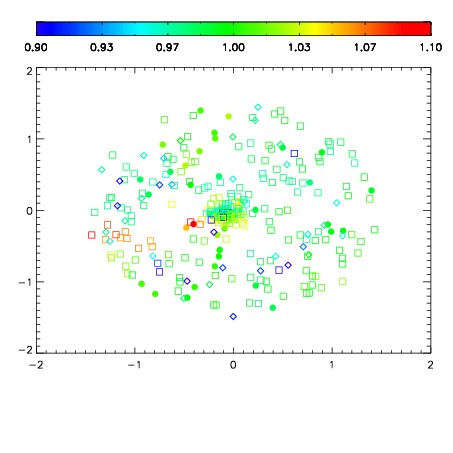
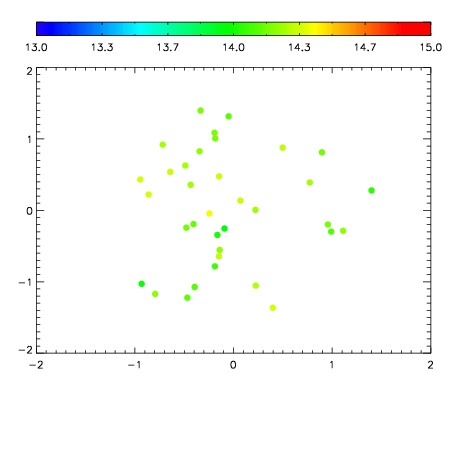
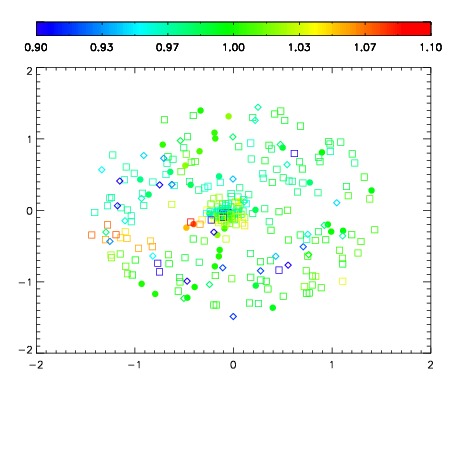
| Spatial mag deviation
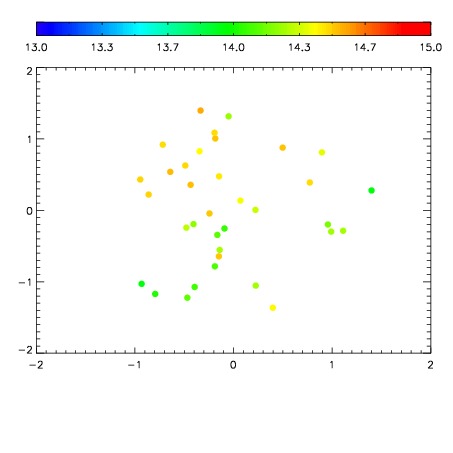
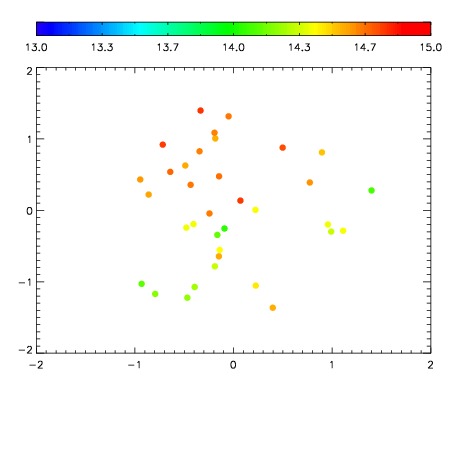
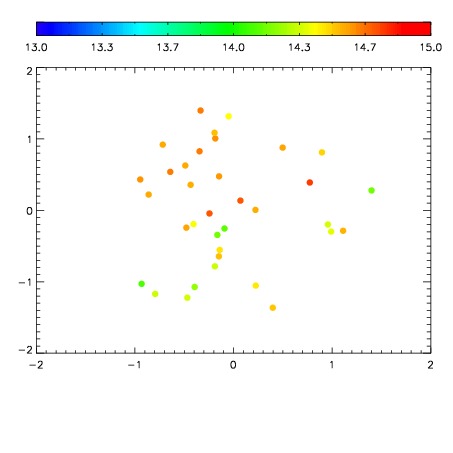
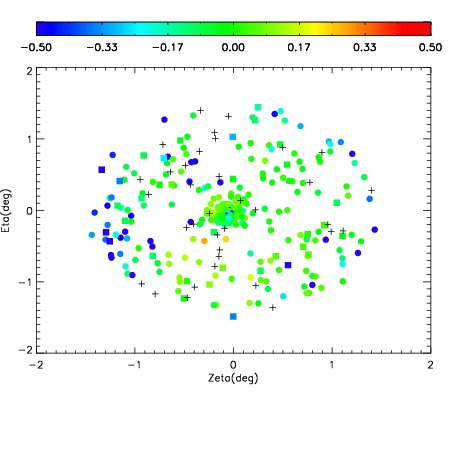
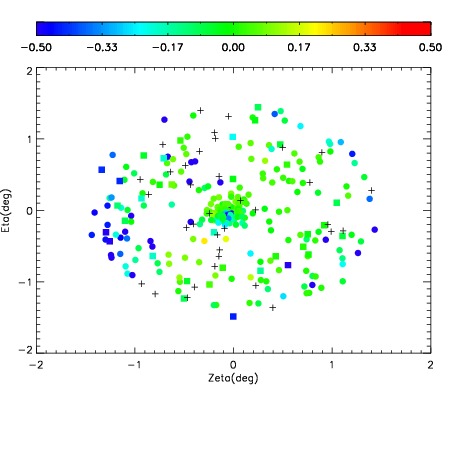
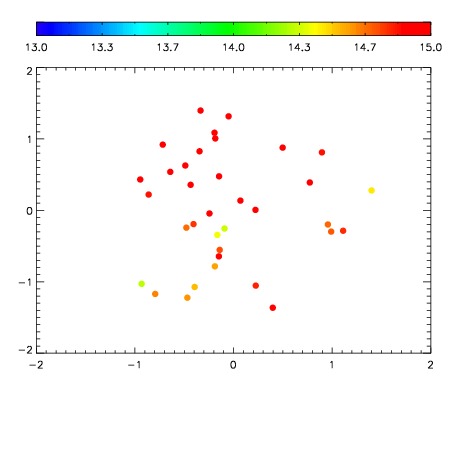
| Spatial sky 16325A emission deviations (filled: sky, open: star)
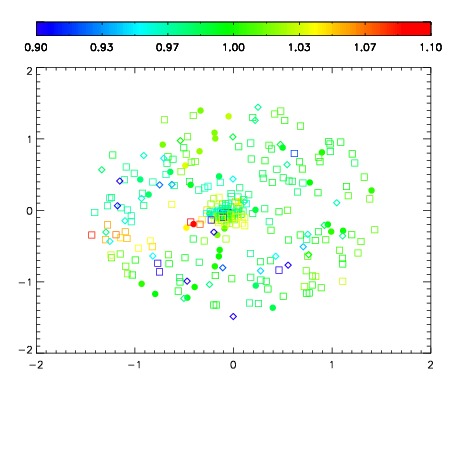
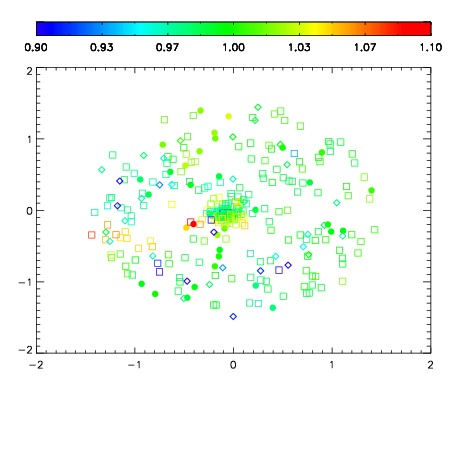
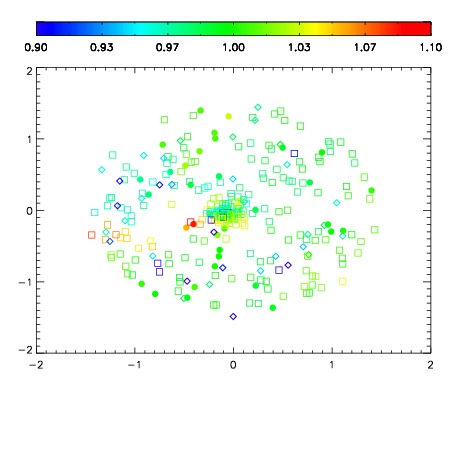
| Spatial sky continuum emission
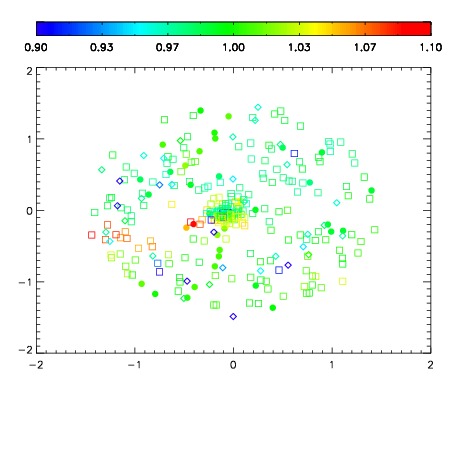
| Spatial sky telluric CO2 absorption deviations (filled: H < 10)
|
| 4600058
| 47
| | Red | Green | Blue
| | z | | 19.04
| | znorm | | 14.85
| | sky | 14.8 | 14.4 | 14.4
| | S/N | 15.2 | 23.2 | 26.4
| | S/N(c) | 11.0 | 28.7 | 49.0
| | SN(E/C) 0.48
|
| 
| 
| 
| 
| 
|
| 4600059
| 47
| | Red | Green | Blue
| | z | | 19.06
| | znorm | | 14.88
| | sky | 14.6 | 14.6 | 14.8
| | S/N | 15.3 | 23.7 | 27.3
| | S/N(c) | 11.0 | 28.7 | 49.4
| | SN(E/C) 0.45
|
| 
| 
| 
| 
| 
|
| 4600060
| 47
| | Red | Green | Blue
| | z | | 19.01
| | znorm | | 14.83
| | sky | 14.6 | 14.5 | 14.6
| | S/N | 15.0 | 23.0 | 27.0
| | S/N(c) | 10.6 | 27.9 | 47.9
| | SN(E/C) 0.46
|
| 
| 
| 
| 
| 
|
| 4600061
| 47
| | Red | Green | Blue
| | z | | 19.04
| | znorm | | 14.86
| | sky | 14.8 | 14.5 | 14.8
| | S/N | 15.2 | 23.3 | 27.6
| | S/N(c) | 10.7 | 28.5 | 48.7
| | SN(E/C) 0.45
|
| 
| 
| 
| 
| 
|
| 4600062
| 47
| | Red | Green | Blue
| | z | | 18.54
| | znorm | | 14.36
| | sky | 14.0 | 14.0 | 14.0
| | S/N | 10.0 | 17.0 | 19.4
| | S/N(c) | 7.8 | 21.6 | 37.3
| | SN(E/C) 0.54
|
| 
| 
| 
| 
| 
|
| 4600063
| 47
| | Red | Green | Blue
| | z | | 18.80
| | znorm | | 14.62
| | sky | 14.1 | 14.2 | 14.3
| | S/N | 12.5 | 20.9 | 23.0
| | S/N(c) | 9.5 | 24.4 | 42.4
| | SN(E/C) 0.47
|
| 
| 
| 
| 
| 
|
| 4600064
| 47
| | Red | Green | Blue
| | z | | 19.05
| | znorm | | 14.87
| | sky | 14.5 | 14.6 | 14.6
| | S/N | 15.1 | 23.3 | 27.8
| | S/N(c) | 10.9 | 28.1 | 48.2
| | SN(E/C) 0.47
|
| 
| 
| 
| 
| 
|
| 4600065
| 47
| | Red | Green | Blue
| | z | | 19.16
| | znorm | | 14.98
| | sky | 14.8 | 14.9 | 14.9
| | S/N | 16.3 | 24.6 | 29.4
| | S/N(c) | 11.6 | 30.1 | 52.7
| | SN(E/C) 0.47
|
| 
| 
| 
| 
| 
|