| Red | Green | Blue | |
| z | 17.64 | ||
| znorm | Inf | ||
| sky | -Inf | -Inf | -Inf |
| S/N | 24.8 | 41.1 | 50.5 |
| S/N(c) | 0.0 | 0.0 | 0.0 |
| SN(E/C) |
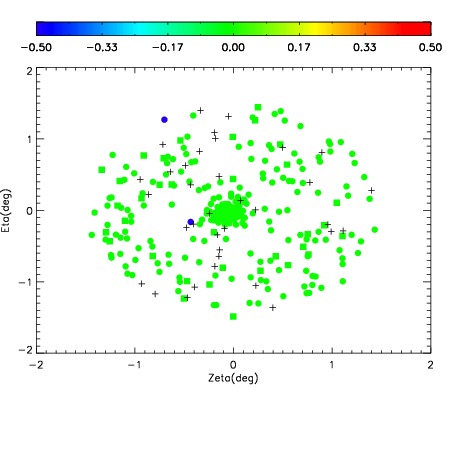
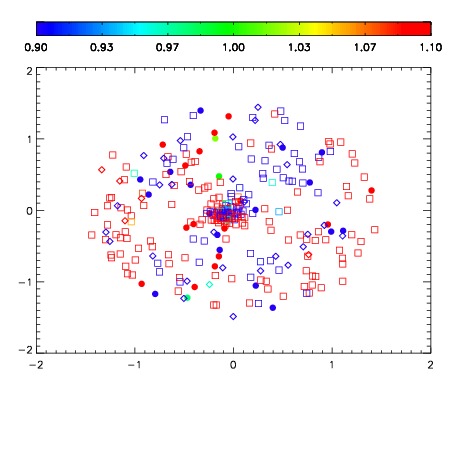
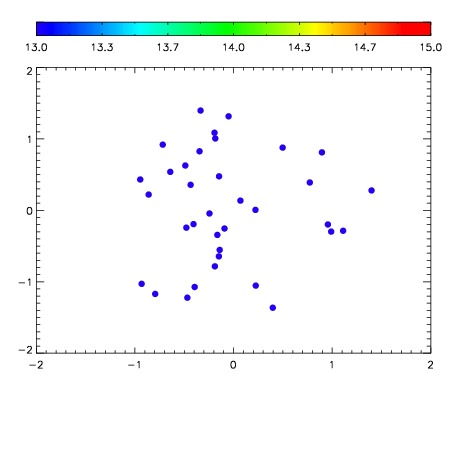

| Frame | Nreads | Zeropoints | Mag plots | Spatial mag deviation | Spatial sky 16325A emission deviations (filled: sky, open: star) | Spatial sky continuum emission | Spatial sky telluric CO2 absorption deviations (filled: H < 10) | |||||||||||||||||||||||
| 0 | 0 |
|
|
|
|
|
|
| IPAIR | NAME | SHIFT | NEWSHIFT | S/N | NAME | SHIFT | NEWSHIFT | S/N |
| 0 | 04600060 | 0.499628 | 0.00000 | 18.9761 | 04600061 | -0.00157298 | 0.501201 | 19.0015 |
| 1 | 04600059 | 0.494137 | 0.00549102 | 19.0246 | 04600065 | -0.000514535 | 0.500143 | 19.1217 |
| 2 | 04600064 | 0.498400 | 0.00122800 | 19.0118 | 04600058 | 0.00000 | 0.499628 | 19.0018 |
| 3 | 04600063 | 0.492582 | 0.00704601 | 18.7834 | 04600062 | -0.00122832 | 0.500856 | 18.5011 |