| Red | Green | Blue | |
| z | 17.64 | ||
| znorm | Inf | ||
| sky | -Inf | -Inf | -Inf |
| S/N | 23.0 | 39.3 | 46.4 |
| S/N(c) | 0.0 | 0.0 | 0.0 |
| SN(E/C) |
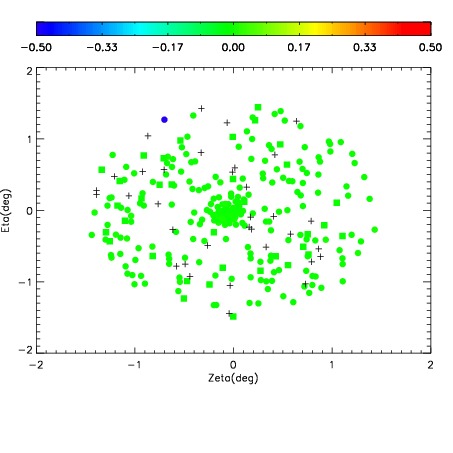
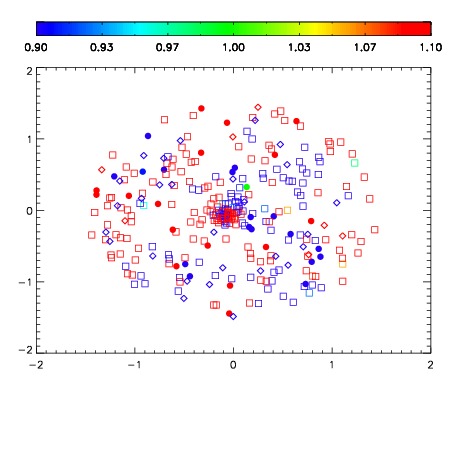
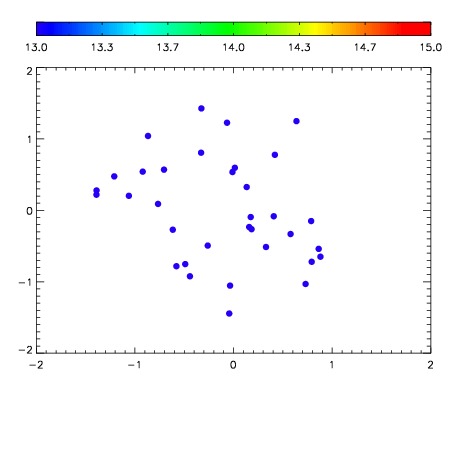

| Frame | Nreads | Zeropoints | Mag plots | Spatial mag deviation | Spatial sky 16325A emission deviations (filled: sky, open: star) | Spatial sky continuum emission | Spatial sky telluric CO2 absorption deviations (filled: H < 10) | |||||||||||||||||||||||
| 0 | 0 |
|
|
|
|
|
|
| IPAIR | NAME | SHIFT | NEWSHIFT | S/N | NAME | SHIFT | NEWSHIFT | S/N |
| 0 | 04360049 | 0.490163 | 0.00000 | 19.0322 | 04360047 | 0.00000 | 0.490163 | 19.0562 |
| 1 | 04360048 | 0.489071 | 0.00109199 | 19.0877 | 04360050 | -0.00282013 | 0.492983 | 19.0889 |
| 2 | 04360053 | 0.487426 | 0.00273699 | 18.9043 | 04360051 | -0.00352522 | 0.493688 | 18.9816 |
| 3 | 04360052 | 0.485732 | 0.00443101 | 18.8077 | 04360054 | -0.00293309 | 0.493096 | 18.3946 |