| Frame | Nreads | Zeropoints | Mag plots
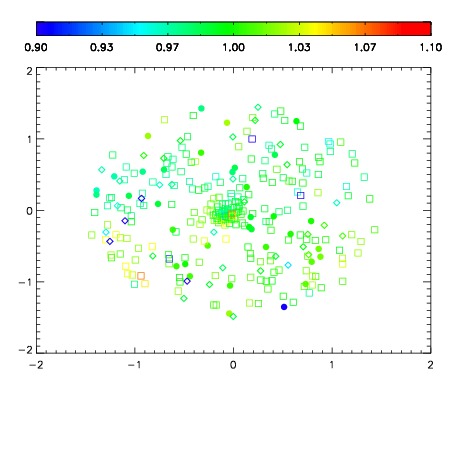
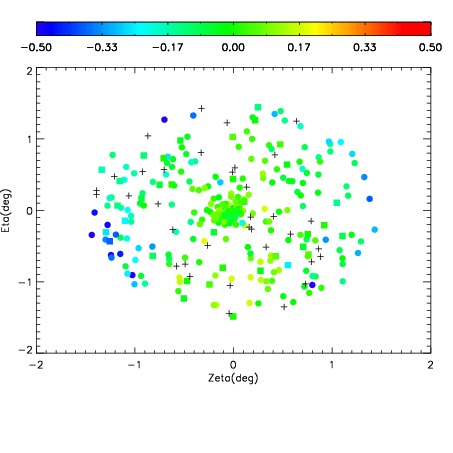
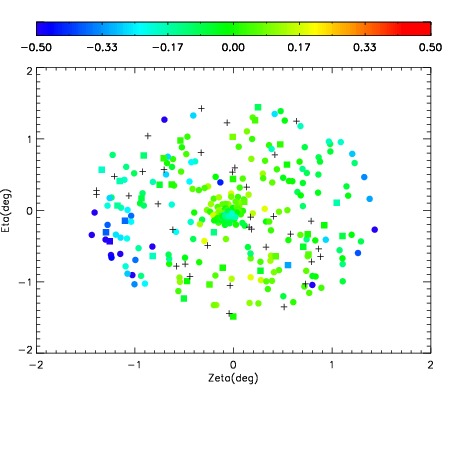
| Spatial mag deviation
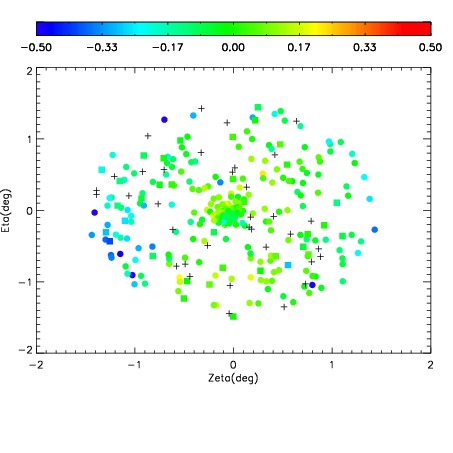
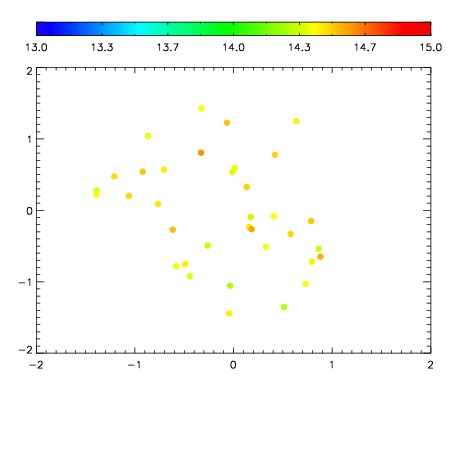
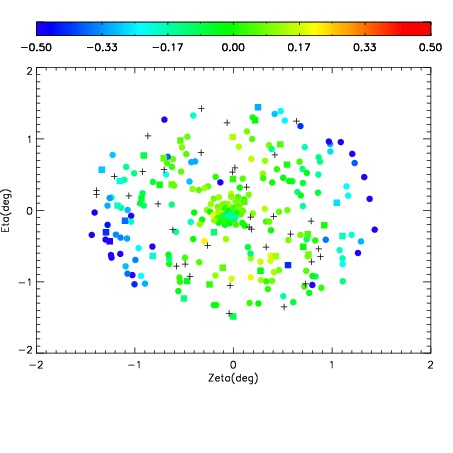
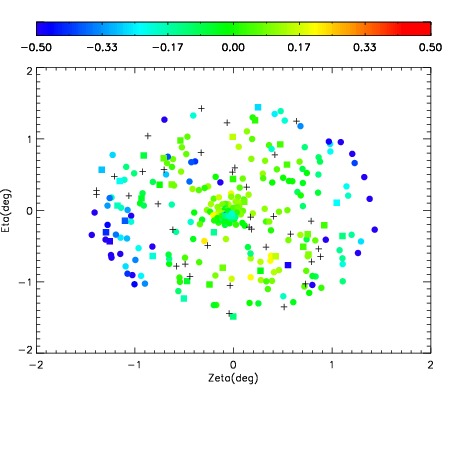
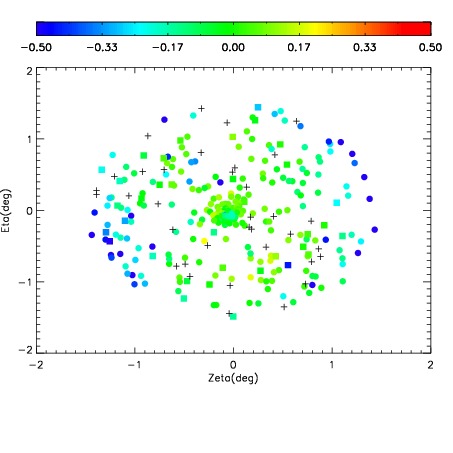
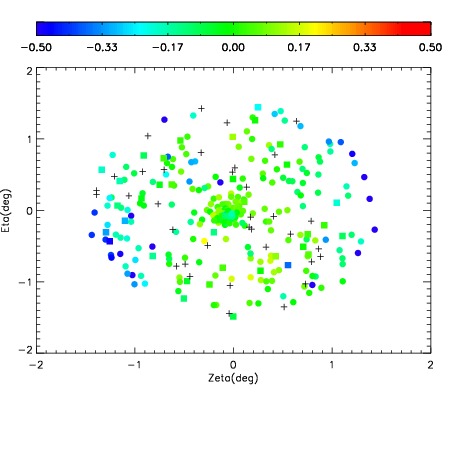
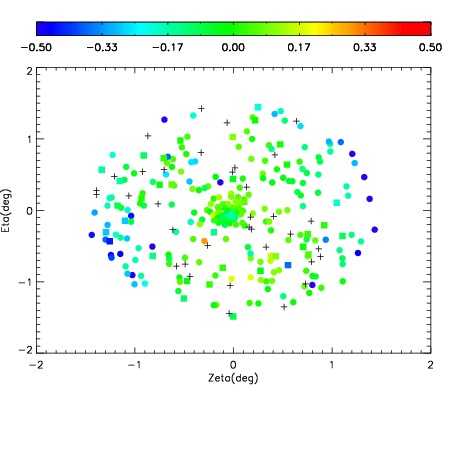
| Spatial sky 16325A emission deviations (filled: sky, open: star)
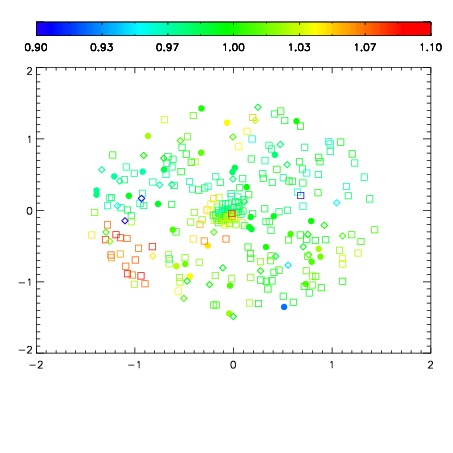
| Spatial sky continuum emission
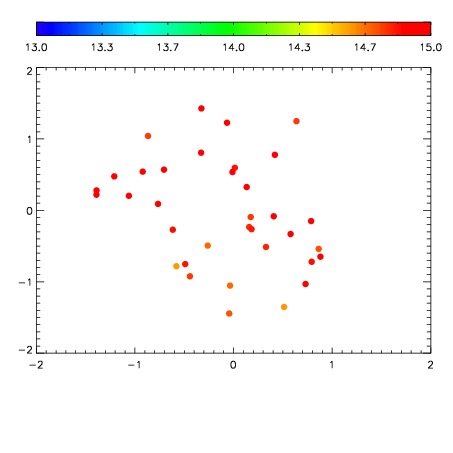
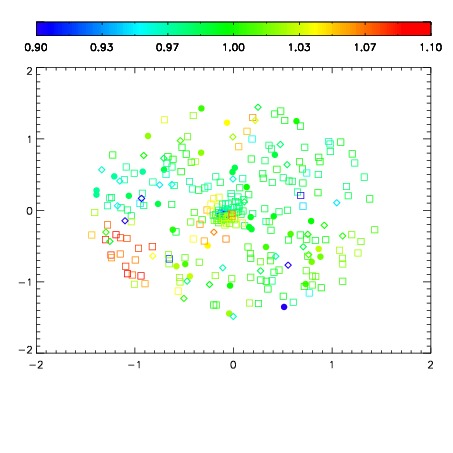
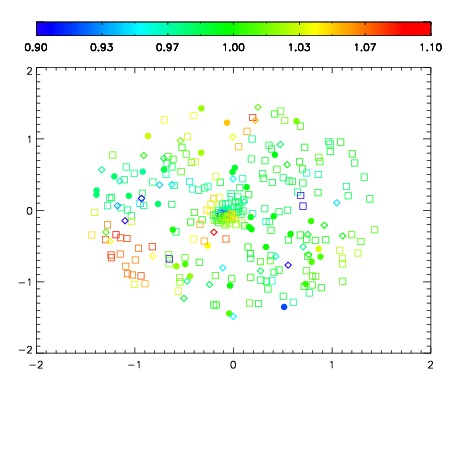
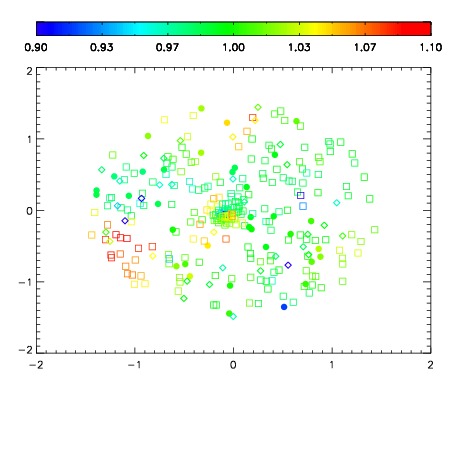
| Spatial sky telluric CO2 absorption deviations (filled: H < 10)
|
| 4630010
| 47
| | Red | Green | Blue
| | z | | 17.79
| | znorm | | 13.61
| | sky | 14.6 | 14.4 | 14.5
| | S/N | 6.8 | 12.5 | 11.4
| | S/N(c) | 11.4 | 14.1 | 6.2
| | SN(E/C) 0.68
|
| 
| 
| 
| 
| 
|
| 4630011
| 47
| | Red | Green | Blue
| | z | | 18.07
| | znorm | | 13.89
| | sky | 15.1 | 14.9 | 15.0
| | S/N | 7.7 | 14.2 | 13.5
| | S/N(c) | 13.8 | 16.2 | 7.2
| | SN(E/C) 0.61
|
| 
| 
| 
| 
| 
|
| 4630012
| 47
| | Red | Green | Blue
| | z | | 17.66
| | znorm | | 13.48
| | sky | 15.1 | 14.9 | 15.1
| | S/N | 5.8 | 11.1 | 10.8
| | S/N(c) | 10.4 | 13.0 | 5.9
| | SN(E/C) 0.73
|
| 
| 
| 
| 
| 
|
| 4630013
| 47
| | Red | Green | Blue
| | z | | 18.06
| | znorm | | 13.88
| | sky | 14.9 | 15.1 | 15.0
| | S/N | 7.5 | 14.2 | 13.2
| | S/N(c) | 13.7 | 16.0 | 7.1
| | SN(E/C) 0.58
|
| 
| 
| 
| 
| 
|
| 4630014
| 47
| | Red | Green | Blue
| | z | | 18.55
| | znorm | | 14.36
| | sky | 15.2 | 15.0 | 15.0
| | S/N | 11.2 | 18.4 | 18.1
| | S/N(c) | 17.8 | 20.3 | 9.4
| | SN(E/C) 0.56
|
| 
| 
| 
| 
| 
|
| 4630015
| 47
| | Red | Green | Blue
| | z | | 18.62
| | znorm | | 14.44
| | sky | 15.4 | 15.1 | 15.1
| | S/N | 10.9 | 19.1 | 18.7
| | S/N(c) | 18.5 | 20.9 | 9.7
| | SN(E/C) 0.55
|
| 
| 
| 
| 
| 
|
| 4630016
| 47
| | Red | Green | Blue
| | z | | 18.72
| | znorm | | 14.54
| | sky | 15.3 | 15.1 | 15.2
| | S/N | 12.0 | 20.2 | 19.9
| | S/N(c) | 19.9 | 22.2 | 10.5
| | SN(E/C) 0.50
|
| 
| 
| 
| 
| 
|
| 4630017
| 47
| | Red | Green | Blue
| | z | | 18.55
| | znorm | | 14.37
| | sky | 15.4 | 15.2 | 15.1
| | S/N | 10.6 | 18.2 | 18.1
| | S/N(c) | 17.6 | 20.2 | 9.6
| | SN(E/C) 0.57
|
| 
| 
| 
| 
| 
|
| 4630018
| 47
| | Red | Green | Blue
| | z | | 18.34
| | znorm | | 14.16
| | sky | 14.9 | 15.1 | 15.2
| | S/N | 9.0 | 16.1 | 15.9
| | S/N(c) | 16.0 | 18.3 | 8.6
| | SN(E/C) 0.55
|
| 
| 
| 
| 
| 
|
| 4630019
| 47
| | Red | Green | Blue
| | z | | 18.29
| | znorm | | 14.11
| | sky | 14.9 | 15.1 | 15.1
| | S/N | 8.5 | 15.7 | 15.4
| | S/N(c) | 15.4 | 18.0 | 8.5
| | SN(E/C) 0.63
|
| 
| 
| 
| 
| 
|