| Red | Green | Blue | |
| z | 17.64 | ||
| znorm | Inf | ||
| sky | -Inf | -Inf | -Inf |
| S/N | 17.7 | 32.7 | 33.6 |
| S/N(c) | 0.0 | 0.0 | 0.0 |
| SN(E/C) |
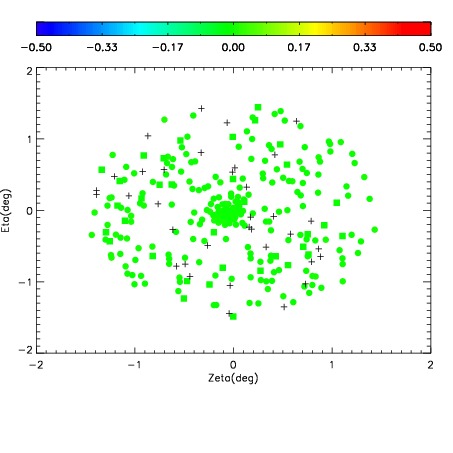
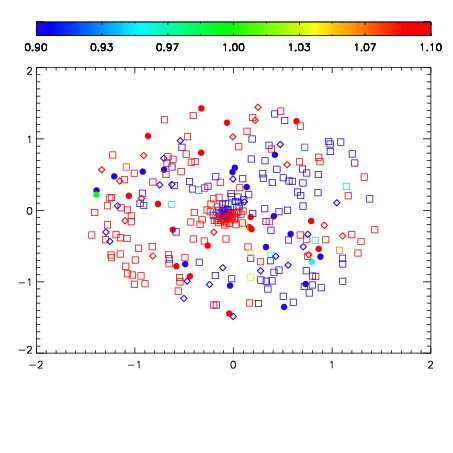
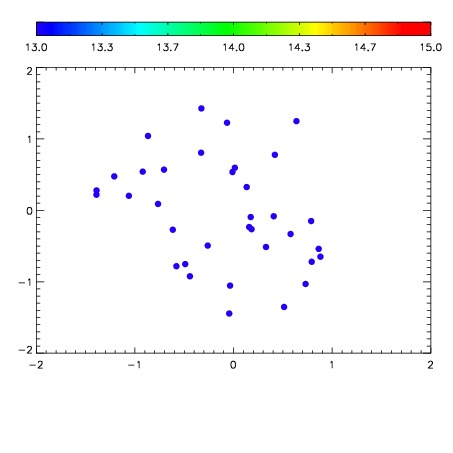

| Frame | Nreads | Zeropoints | Mag plots | Spatial mag deviation | Spatial sky 16325A emission deviations (filled: sky, open: star) | Spatial sky continuum emission | Spatial sky telluric CO2 absorption deviations (filled: H < 10) | |||||||||||||||||||||||
| 0 | 0 |
|
|
|
|
|
|
| IPAIR | NAME | SHIFT | NEWSHIFT | S/N | NAME | SHIFT | NEWSHIFT | S/N |
| 0 | 04630012 | 0.497020 | 0.00000 | 17.6452 | 04630010 | 0.00000 | 0.497020 | 17.7699 |
| 1 | 04630016 | 0.494941 | 0.00207901 | 18.6915 | 04630017 | -0.00110900 | 0.498129 | 18.5174 |
| 2 | 04630015 | 0.493829 | 0.00319099 | 18.5853 | 04630014 | -0.000922100 | 0.497942 | 18.5148 |
| 3 | 04630019 | 0.496228 | 0.000791997 | 18.2649 | 04630018 | -0.00115813 | 0.498178 | 18.3088 |
| 4 | 04630011 | 0.495798 | 0.00122201 | 18.0502 | 04630013 | -0.00177842 | 0.498798 | 18.0326 |