| Red | Green | Blue | |
| z | 17.64 | ||
| znorm | Inf | ||
| sky | -Inf | -Inf | -Inf |
| S/N | 29.1 | 49.3 | 52.4 |
| S/N(c) | 0.0 | 0.0 | 0.0 |
| SN(E/C) |


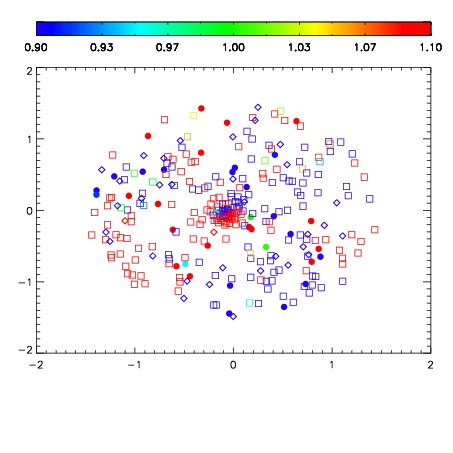


| Frame | Nreads | Zeropoints | Mag plots | Spatial mag deviation | Spatial sky 16325A emission deviations (filled: sky, open: star) | Spatial sky continuum emission | Spatial sky telluric CO2 absorption deviations (filled: H < 10) | |||||||||||||||||||||||
| 0 | 0 |
|
|
|
|
|
|
| IPAIR | NAME | SHIFT | NEWSHIFT | S/N | NAME | SHIFT | NEWSHIFT | S/N |
| 0 | 04650038 | 0.500397 | 0.00000 | 19.2317 | 04650040 | 0.00433400 | 0.496063 | 19.2207 |
| 1 | 04650037 | 0.496820 | 0.00357702 | 19.2183 | 04650039 | 0.00503007 | 0.495367 | 19.2033 |
| 2 | 04650042 | 0.499766 | 0.000631034 | 19.1169 | 04650036 | 0.00000 | 0.500397 | 19.1766 |
| 3 | 04650041 | 0.497846 | 0.00255102 | 19.0967 | 04650043 | 0.00294638 | 0.497451 | 19.0933 |