| Red | Green | Blue | |
| z | 17.64 | ||
| znorm | Inf | ||
| sky | -Inf | -Inf | -Inf |
| S/N | 23.6 | 41.0 | 43.2 |
| S/N(c) | 0.0 | 0.0 | 0.0 |
| SN(E/C) |


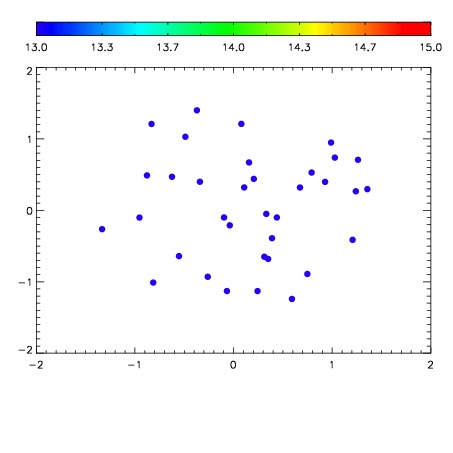

| Frame | Nreads | Zeropoints | Mag plots | Spatial mag deviation | Spatial sky 16325A emission deviations (filled: sky, open: star) | Spatial sky continuum emission | Spatial sky telluric CO2 absorption deviations (filled: H < 10) | |||||||||||||||||||||||
| 0 | 0 |
|
|
|
|
|
|
| IPAIR | NAME | SHIFT | NEWSHIFT | S/N | NAME | SHIFT | NEWSHIFT | S/N |
| 0 | 05150045 | 0.499761 | 0.00000 | 19.1062 | 05150042 | 0.00185581 | 0.497905 | 19.0771 |
| 1 | 05150041 | 0.496536 | 0.00322500 | 19.1164 | 05150043 | -0.00146518 | 0.501226 | 19.0910 |
| 2 | 05150044 | 0.497305 | 0.00245598 | 19.0957 | 05150046 | 0.00160948 | 0.498152 | 19.0660 |
| 3 | 05150040 | 0.495349 | 0.00441200 | 19.0468 | 05150039 | 0.00000 | 0.499761 | 19.0115 |