| Red | Green | Blue | |
| z | 17.64 | ||
| znorm | Inf | ||
| sky | -Inf | -Inf | -Inf |
| S/N | 25.1 | 44.2 | 45.6 |
| S/N(c) | 0.0 | 0.0 | 0.0 |
| SN(E/C) |
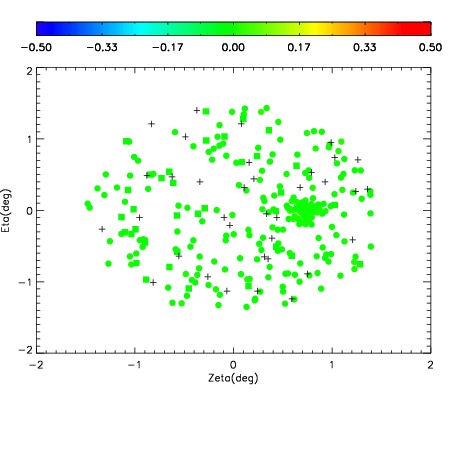
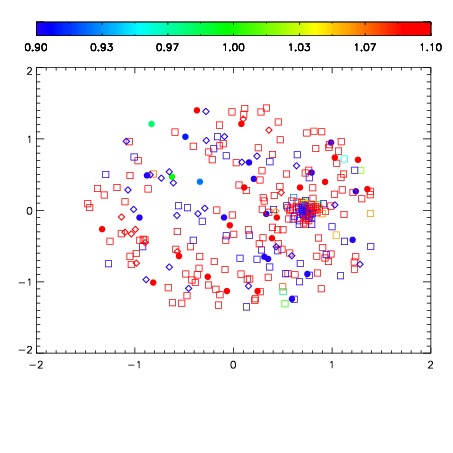
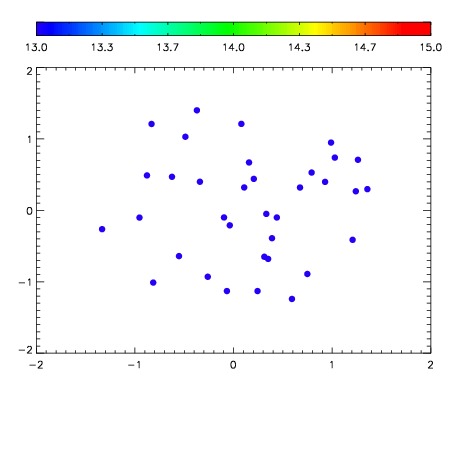

| Frame | Nreads | Zeropoints | Mag plots | Spatial mag deviation | Spatial sky 16325A emission deviations (filled: sky, open: star) | Spatial sky continuum emission | Spatial sky telluric CO2 absorption deviations (filled: H < 10) | |||||||||||||||||||||||
| 0 | 0 |
|
|
|
|
|
|
| IPAIR | NAME | SHIFT | NEWSHIFT | S/N | NAME | SHIFT | NEWSHIFT | S/N |
| 0 | 05250017 | 0.491084 | 0.00000 | 19.0795 | 05250018 | 0.00294127 | 0.488143 | 19.0809 |
| 1 | 05250013 | 0.490093 | 0.000991017 | 19.0956 | 05250011 | 0.00000 | 0.491084 | 19.1293 |
| 2 | 05250012 | 0.489052 | 0.00203201 | 19.0710 | 05250014 | 0.000883744 | 0.490200 | 18.9834 |
| 3 | 05250016 | 0.490937 | 0.000147015 | 19.0330 | 05250015 | 0.00216944 | 0.488915 | 18.9738 |