| Red | Green | Blue | |
| z | 17.64 | ||
| znorm | Inf | ||
| sky | -Inf | -Inf | -Inf |
| S/N | 26.7 | 46.2 | 53.9 |
| S/N(c) | 0.0 | 0.0 | 0.0 |
| SN(E/C) |


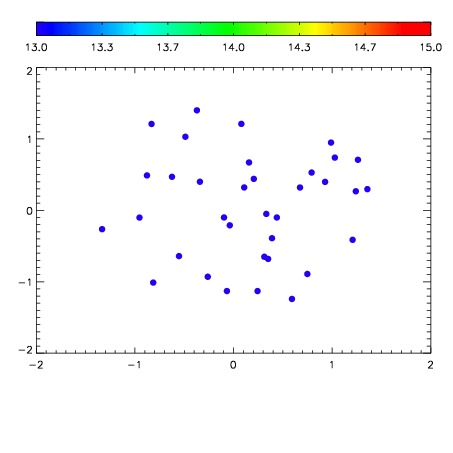

| Frame | Nreads | Zeropoints | Mag plots | Spatial mag deviation | Spatial sky 16325A emission deviations (filled: sky, open: star) | Spatial sky continuum emission | Spatial sky telluric CO2 absorption deviations (filled: H < 10) | |||||||||||||||||||||||
| 0 | 0 |
|
|
|
|
|
|
| IPAIR | NAME | SHIFT | NEWSHIFT | S/N | NAME | SHIFT | NEWSHIFT | S/N |
| 0 | 07850102 | 0.471799 | 0.00000 | 18.7766 | 07850100 | 0.00359705 | 0.468202 | 18.7942 |
| 1 | 07850101 | 0.470899 | 0.000900000 | 18.8451 | 07850096 | 0.00194040 | 0.469859 | 18.8516 |
| 2 | 07850097 | 0.467741 | 0.00405797 | 18.8337 | 07850099 | 0.00412184 | 0.467677 | 18.8325 |
| 3 | 07850098 | 0.468177 | 0.00362200 | 18.8188 | 07850103 | 0.00566605 | 0.466133 | 18.7996 |
| 4 | 07850094 | 0.469503 | 0.00229600 | 18.7516 | 07850095 | 0.00392781 | 0.467871 | 18.7888 |
| 5 | 07850093 | 0.469069 | 0.00272998 | 18.6516 | 07850092 | 0.00000 | 0.471799 | 18.6205 |