| Red | Green | Blue | |
| z | 17.64 | ||
| znorm | Inf | ||
| sky | -Inf | -Inf | -Inf |
| S/N | 21.5 | 34.8 | 38.0 |
| S/N(c) | 0.0 | 0.0 | 0.0 |
| SN(E/C) |
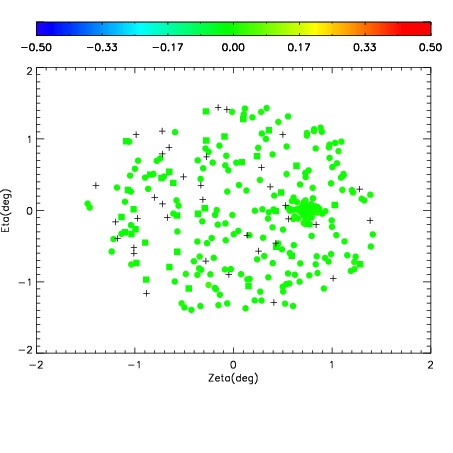
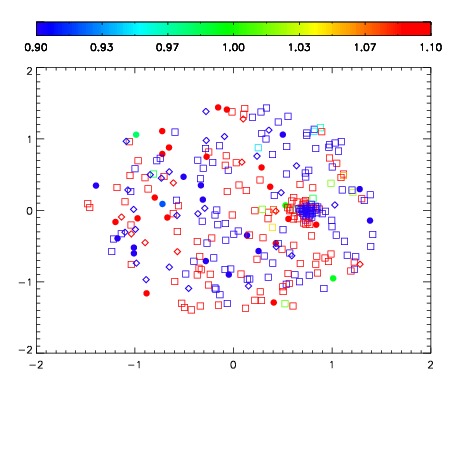
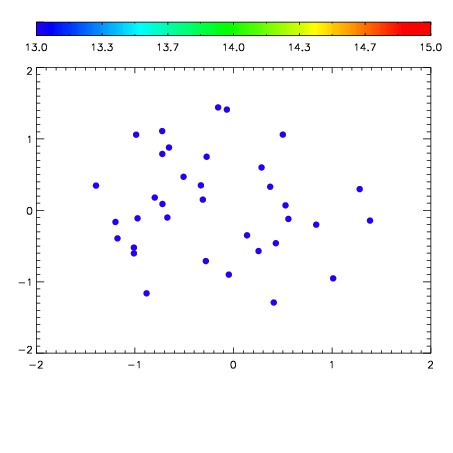

| Frame | Nreads | Zeropoints | Mag plots | Spatial mag deviation | Spatial sky 16325A emission deviations (filled: sky, open: star) | Spatial sky continuum emission | Spatial sky telluric CO2 absorption deviations (filled: H < 10) | |||||||||||||||||||||||
| 0 | 0 |
|
|
|
|
|
|
| IPAIR | NAME | SHIFT | NEWSHIFT | S/N | NAME | SHIFT | NEWSHIFT | S/N |
| 0 | 05490023 | 0.486803 | 0.00000 | 18.7657 | 05490022 | 0.00000 | 0.486803 | 18.8255 |
| 1 | 05490028 | 0.486532 | 0.000270993 | 18.7529 | 05490026 | 0.00118118 | 0.485622 | 18.6910 |
| 2 | 05490024 | 0.486685 | 0.000117987 | 18.7512 | 05490025 | 0.00139872 | 0.485404 | 18.6865 |
| 3 | 05490027 | 0.485930 | 0.000872999 | 18.6464 | 05490029 | 0.00195872 | 0.484844 | 18.4993 |